Demo library
116 prompts, 116 working options tools.
Every demo below is a real cvforge session: a sentence typed in plain English, an AI agent building the tool against connected U.S. options data, and the result running on screen. Each page carries the exact prompt, so you can copy it and get the same tool.
Volume versus open interest
Contracts trading more today than the open interest they started with, and how to read the ratio without over-claiming what it means.
Read the guide →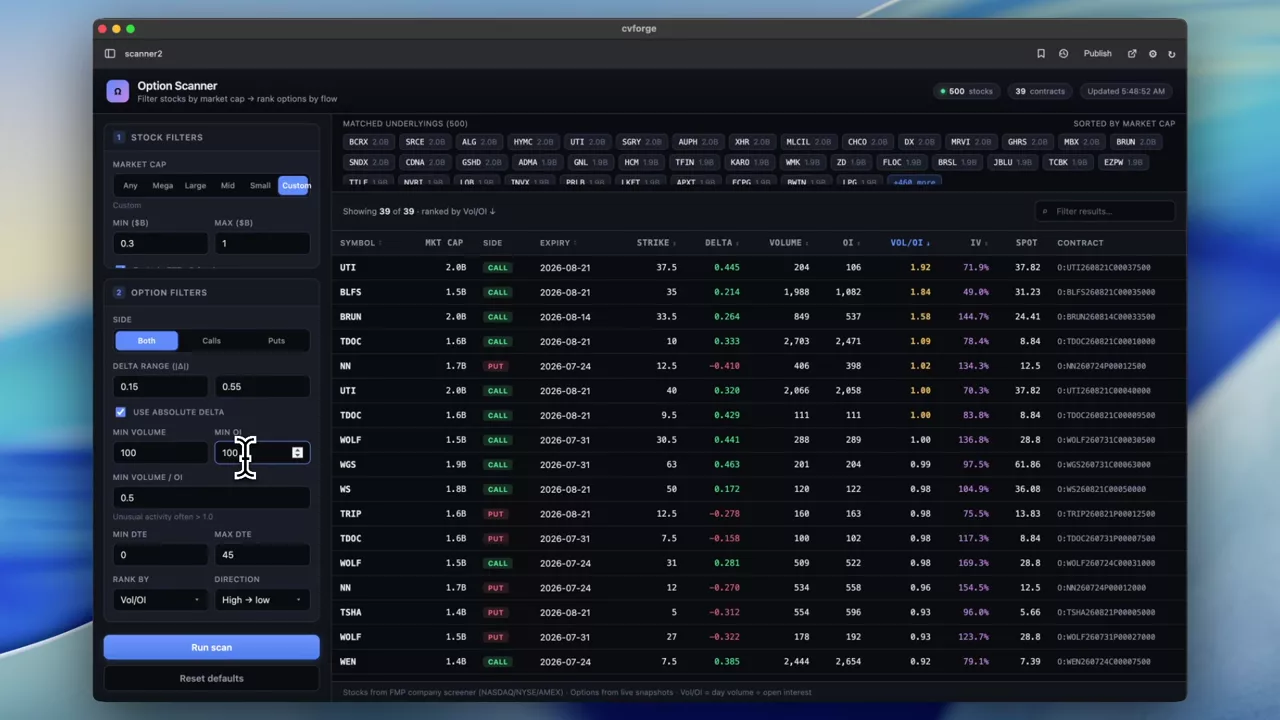 0:52
A two-stage scanner: filter the stocks, then their options
Market cap narrows the universe of underlyings first, then delta, volume, open interest and the volume/OI ratio rank the contracts within it.
 0:33
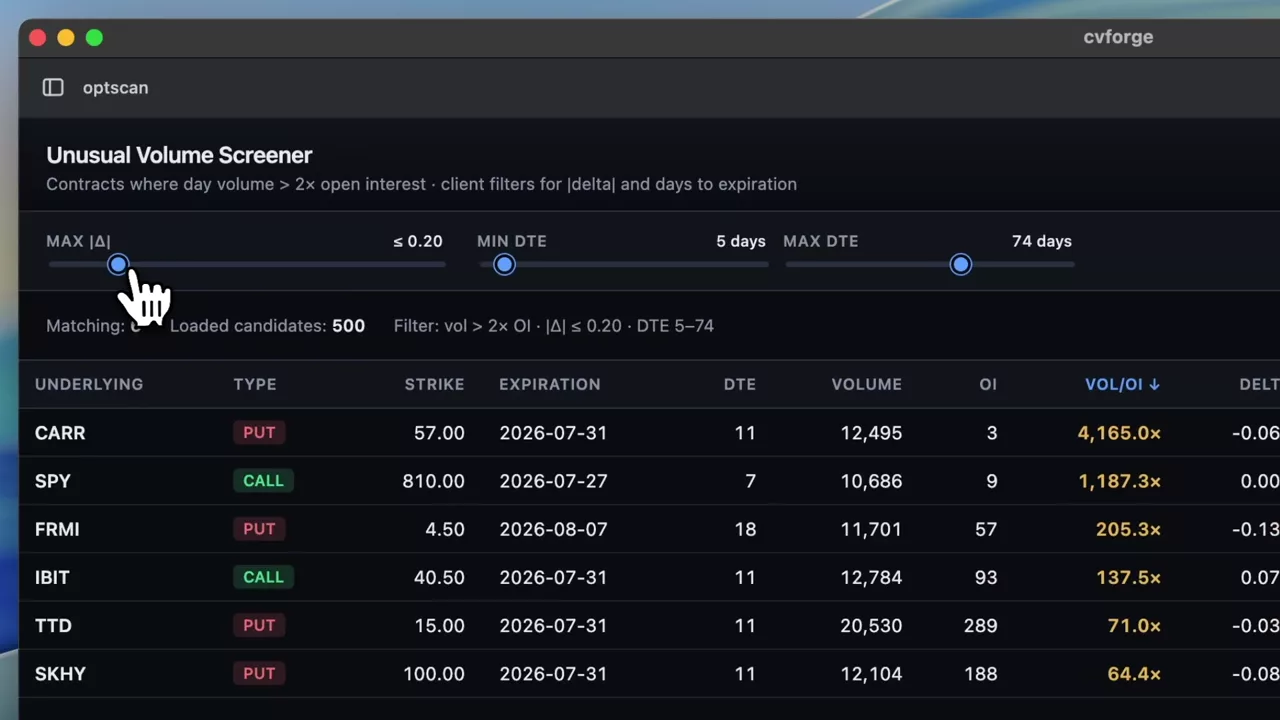
A 2× volume-to-open-interest table with delta and DTE sliders
Contracts trading at more than twice their open interest, with sliders for absolute delta and days to expiration so the threshold is yours rather than a default.
 1:05
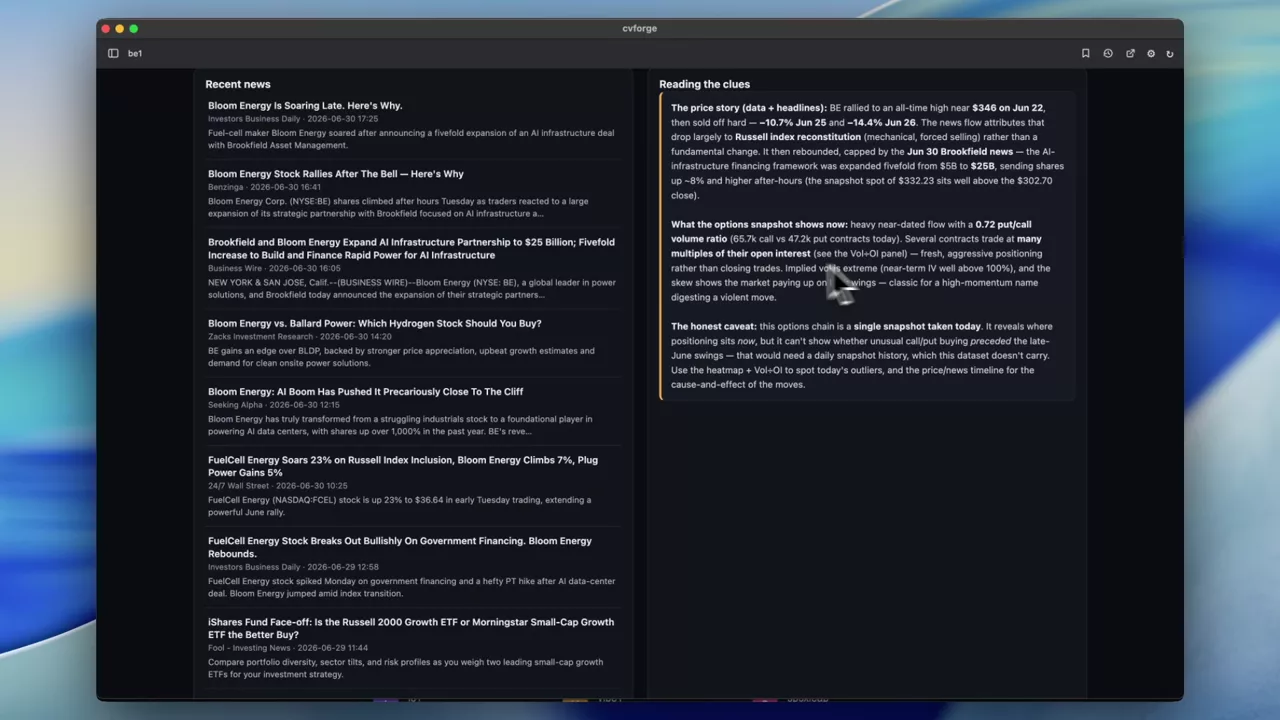
Looking for option clues before a Bloom Energy move
A heatmap of BE option activity plotted with the stock price and news, built to ask whether the option market showed anything before a sharp move.
BE
 0:47
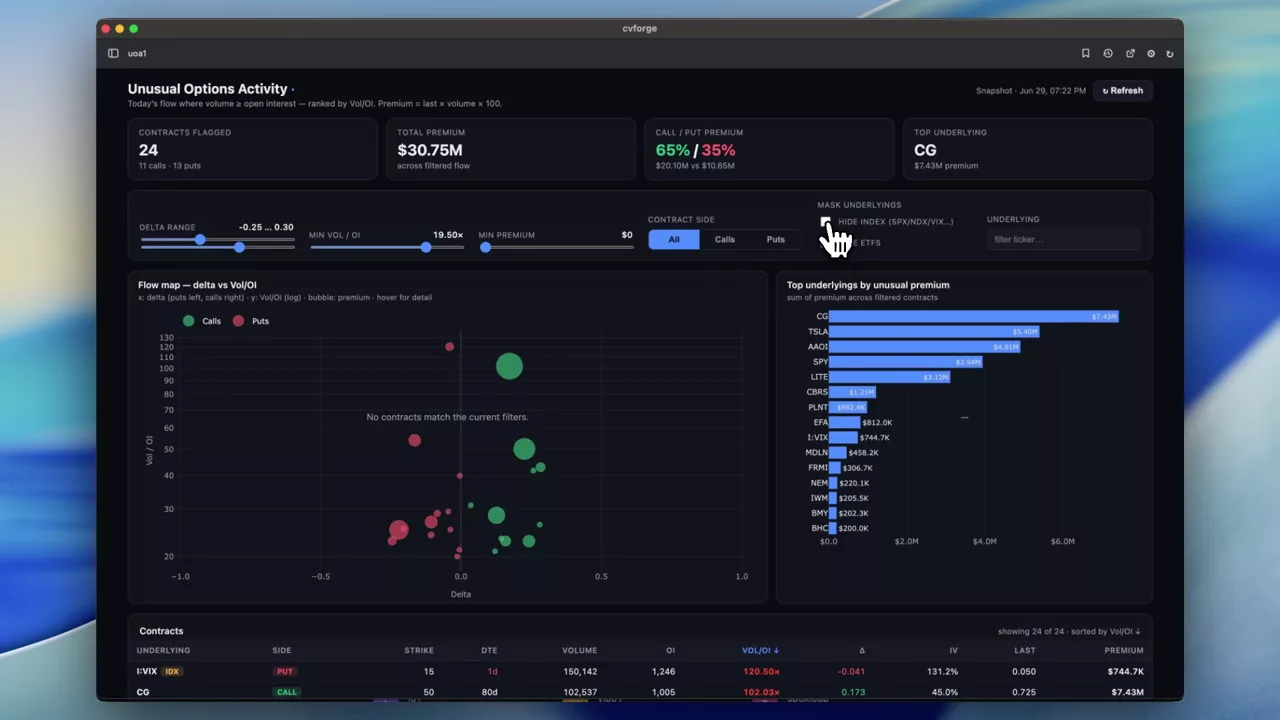
A filterable board of today’s option-activity outliers
The same daily outlier view with controls added — delta, volume/OI ratio, and a mask for index and ETF contracts — so the list can be narrowed to what you trade.
 0:44
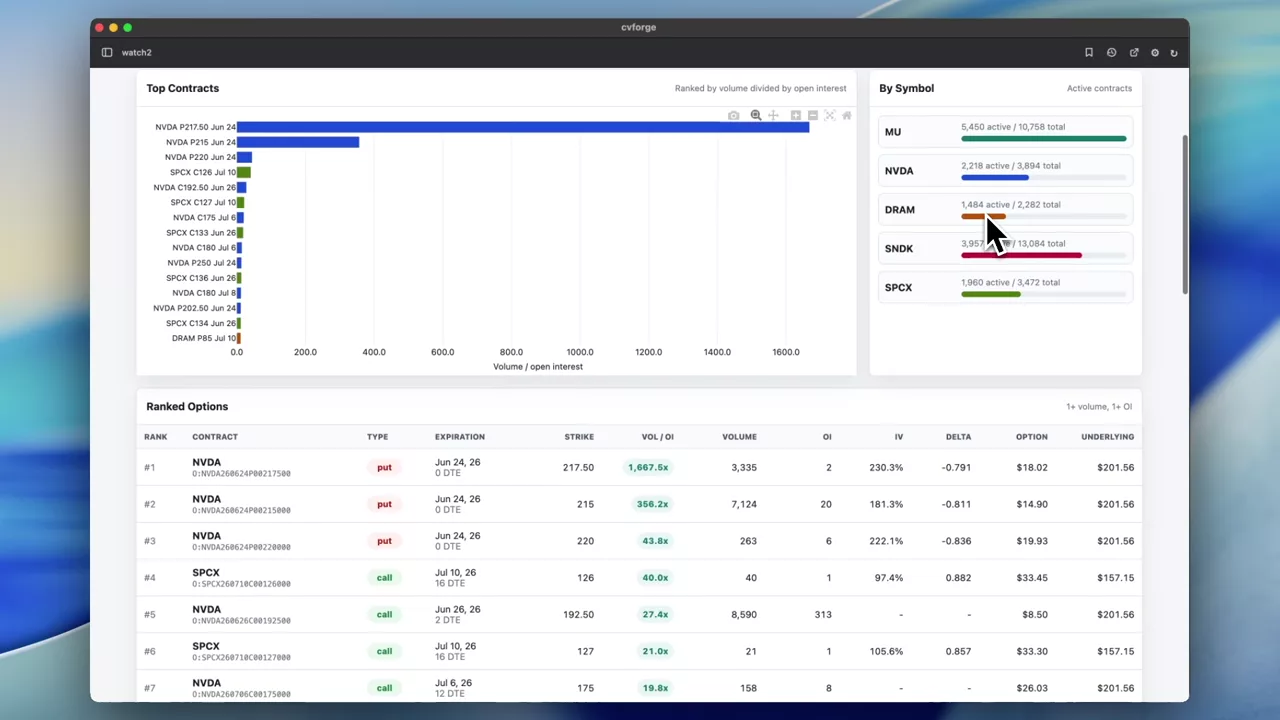
A watchlist ranked by volume-to-open-interest ratio
An editable watchlist across the top, a table of its highest volume/OI contracts underneath — a monitoring tool for names you already care about.
MU · NVDA · DRAM · SNDK
 1:46
Volume/OI against absolute delta for the top 50 contracts
The ratio on one axis and absolute delta on the other, for the busiest contracts market-wide, with row-count controls and index and ETF options excluded by default.
WBI
 1:35
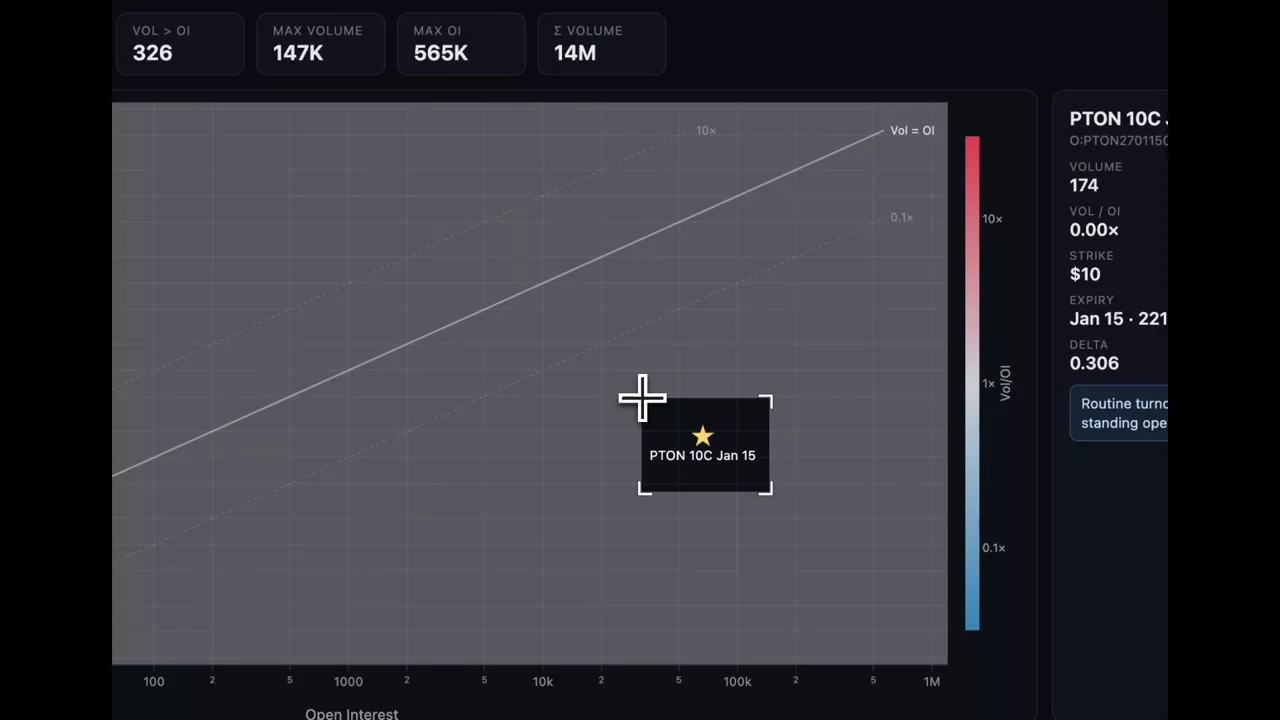
Finding the biggest volume and open-interest outliers
A deliberately open prompt — show me the biggest outliers in volume and open interest — and the visualisation it produced for spotting them.
 0:42
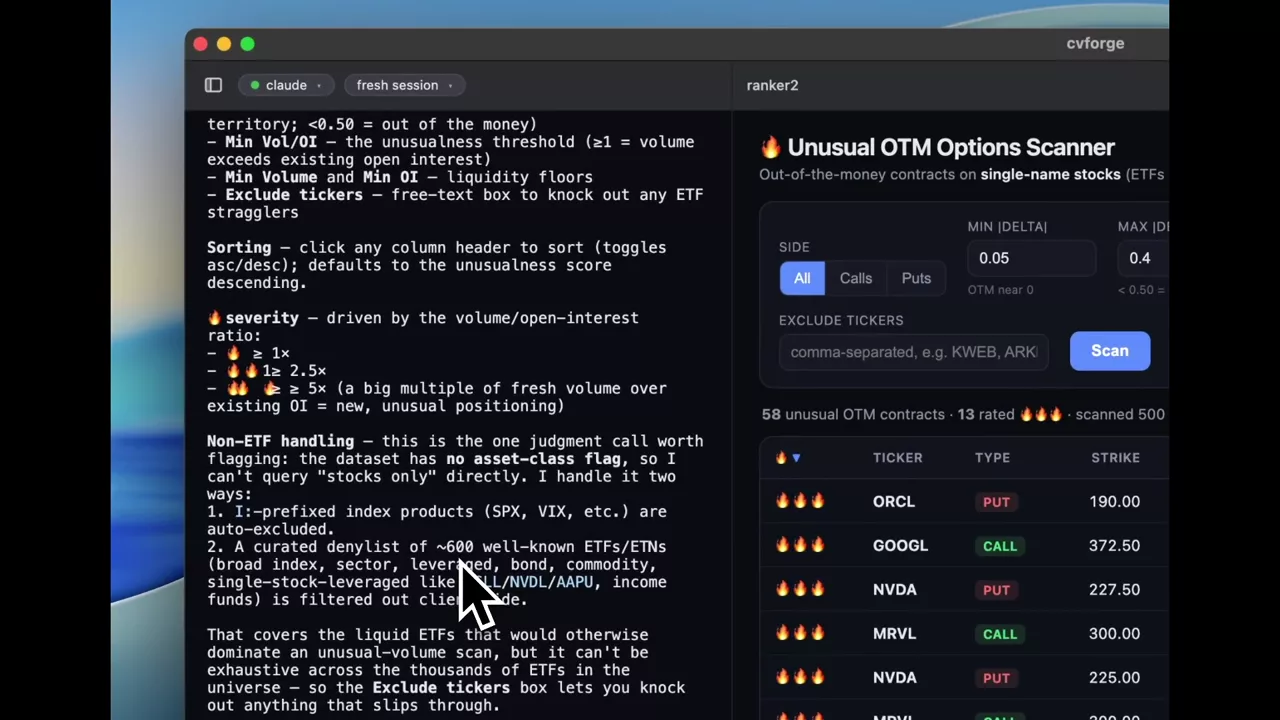
A severity-scored screener for out-of-the-money option activity
Filters for delta, volume/OI ratio, volume and open interest, ETFs excluded, with a one-to-three fire-emoji score marking how far from normal each row sits.
NVDA · MRVL
 0:59
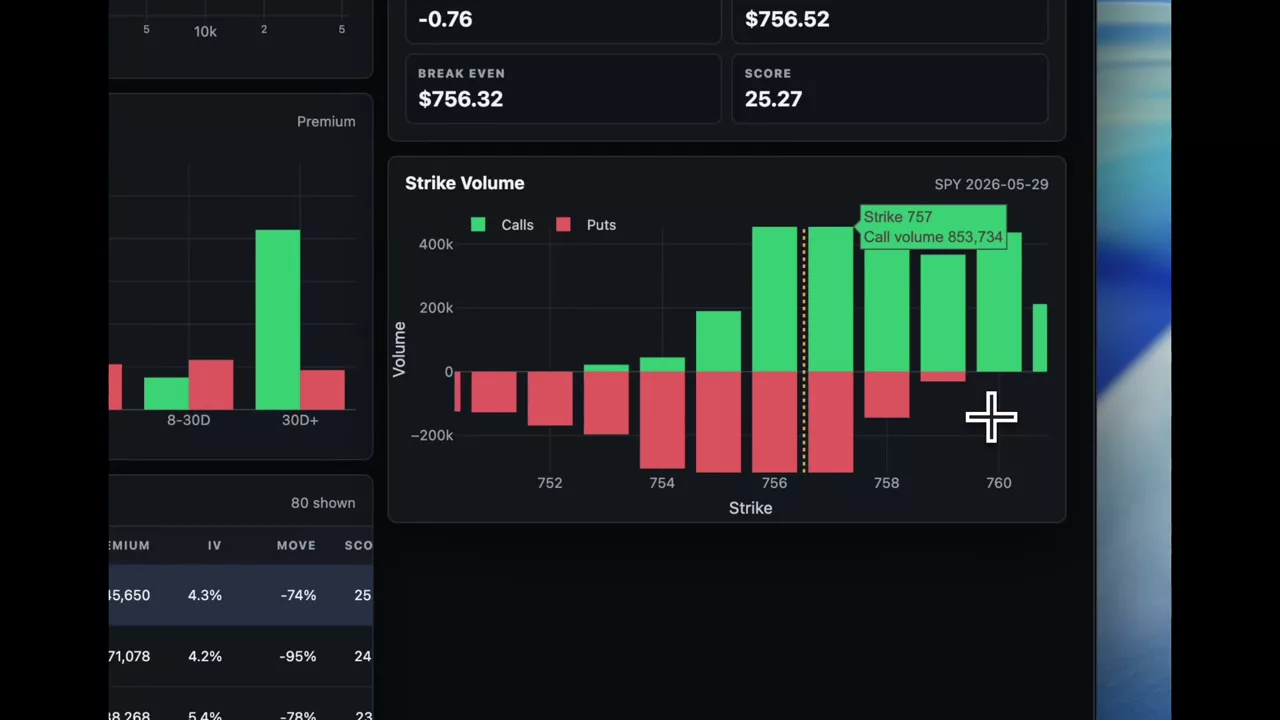
A daily board of contracts trading far above their open interest
The day’s outliers ranked by premium against volume and open interest, with strike volume, premium by underlying and expiration pressure alongside.
 0:44
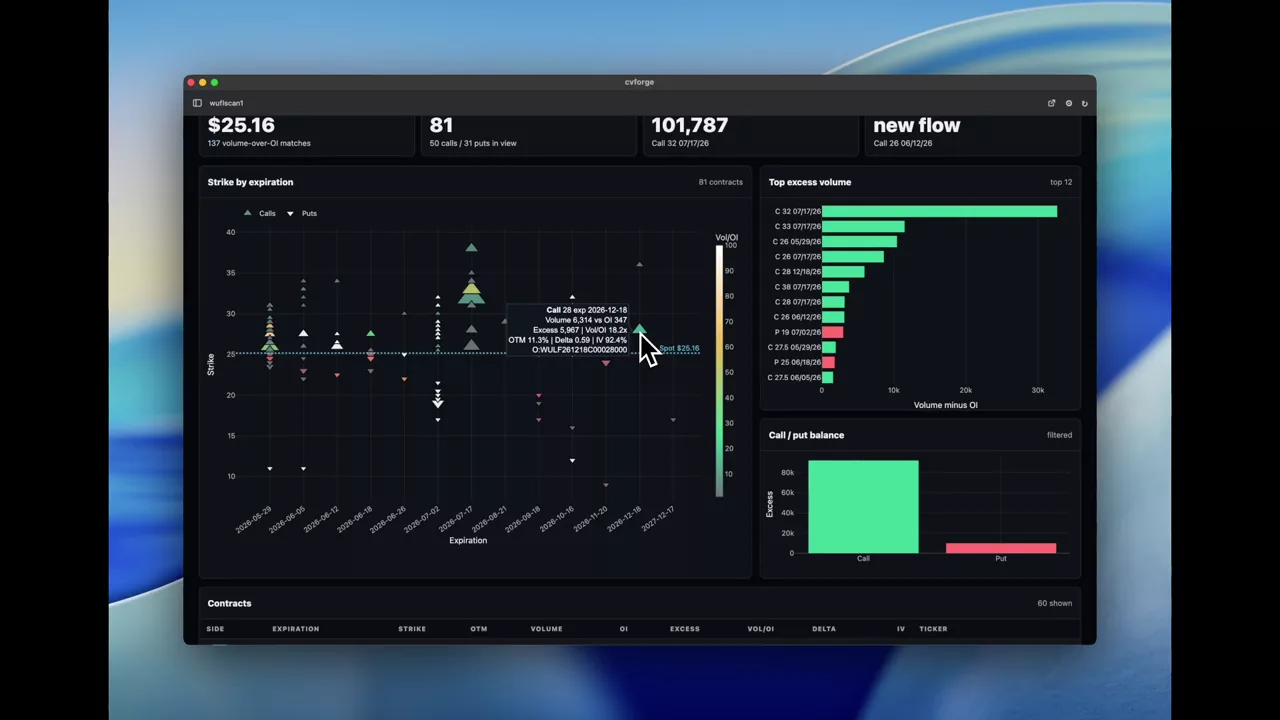
WULF contracts that traded above their open interest, OTM first
A single-name view of where volume exceeded open interest for WULF, weighted toward out-of-the-money strikes as the prompt asked.
WULF
 1:42
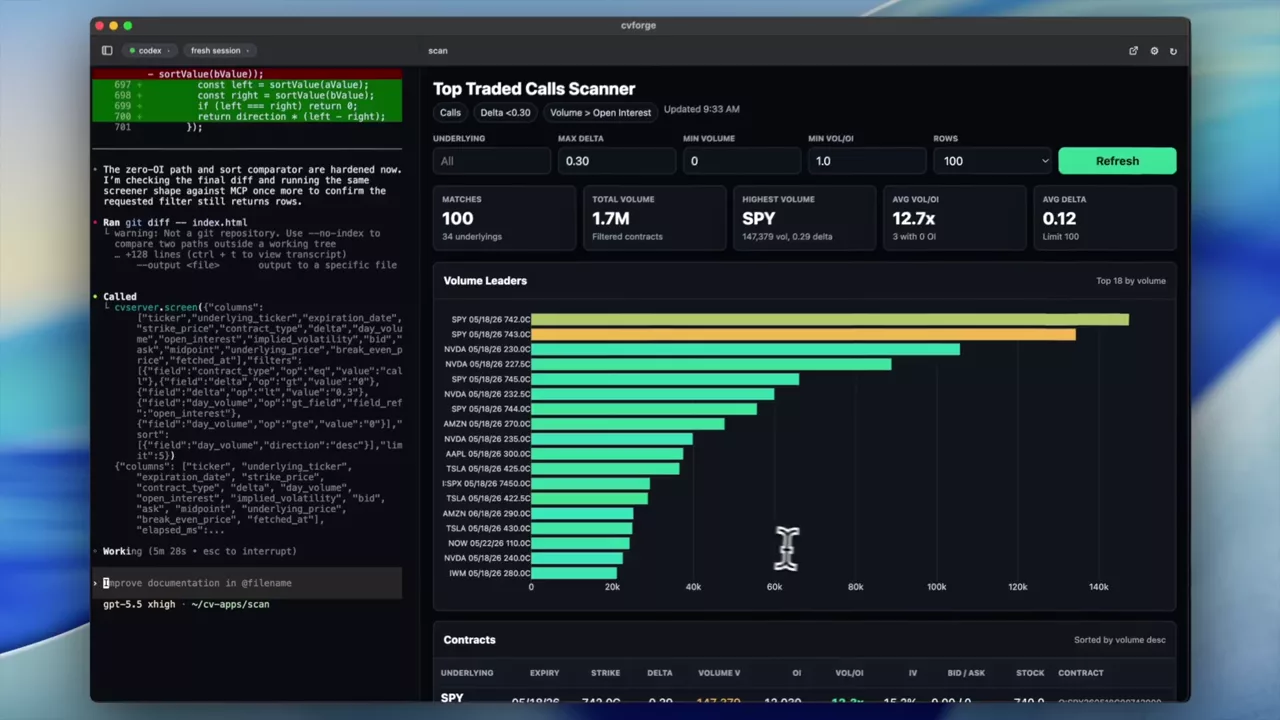
Top-traded calls under 0.30 delta with volume above open interest
Two conditions in one sentence: calls below 0.30 delta, and volume higher than the open interest they started the day with, ranked by activity.
Volume and open interest by strike
Where the day’s activity actually sits across the chain — by strike, by expiration, and as heatmaps.
Read the guide →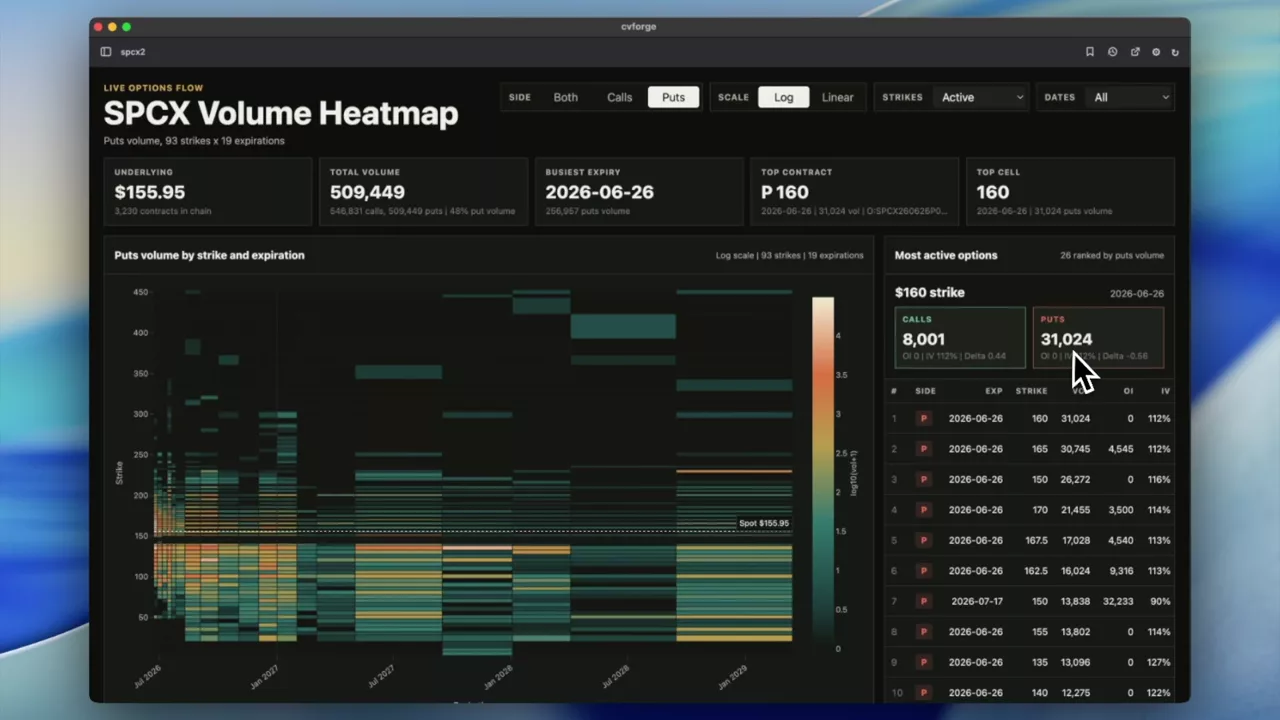 0:33
SPCX volume as a strike-by-expiration heatmap
Every SPCX contract in one grid — strikes down one axis, expirations across the other, volume as colour — so the most active contracts are immediately visible.
SPCX
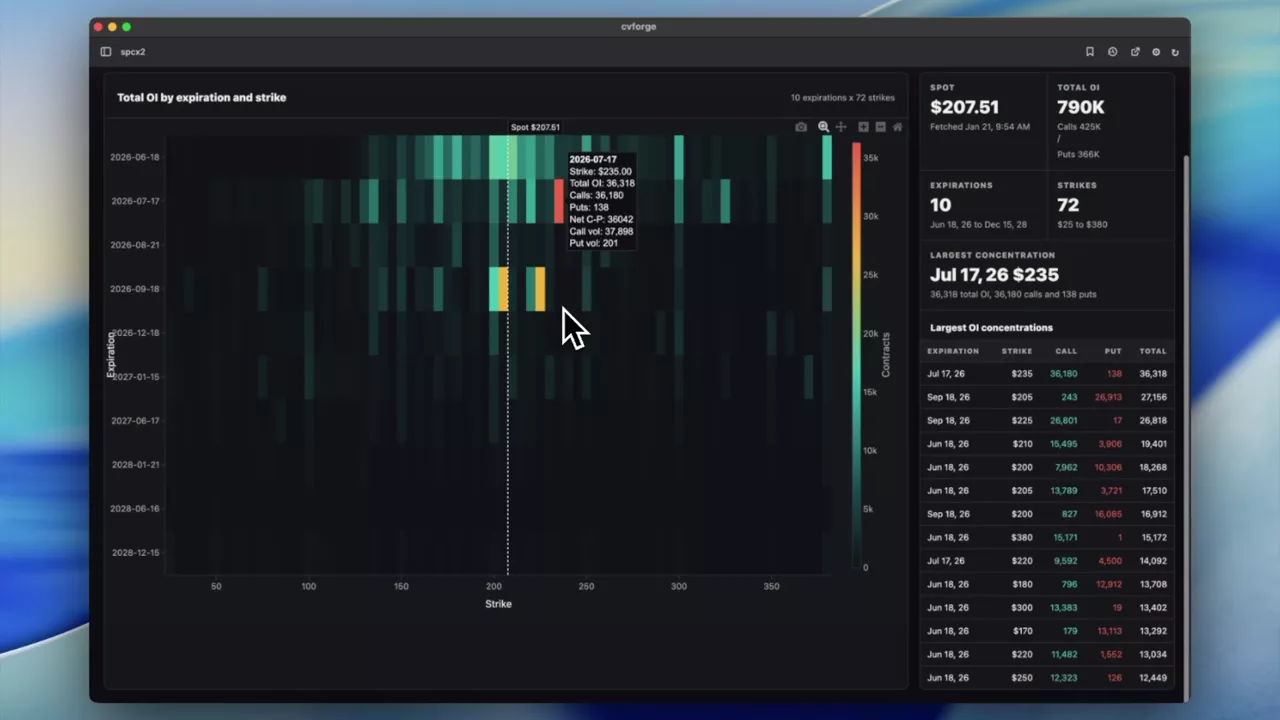 1:05
SPCX open interest as a heatmap, and the one strike that stands out
The same grid built on open interest rather than volume, which surfaces standing positions instead of today’s trading — a single July call dominated.
SPCX
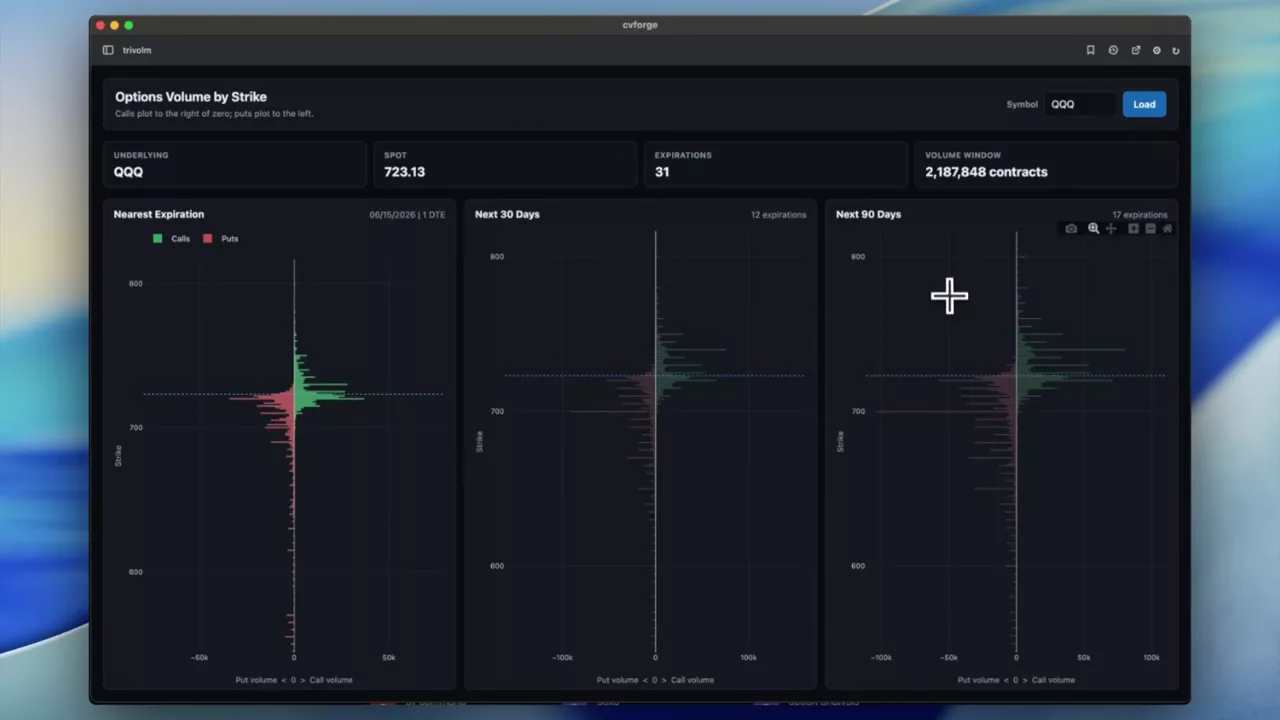 1:03
Call volume up, put volume down, across three expirations
Strikes on the vertical axis, call volume rendered positive and put volume negative, in three panels ordered from the nearest expiration outward.
SPY · QQQ
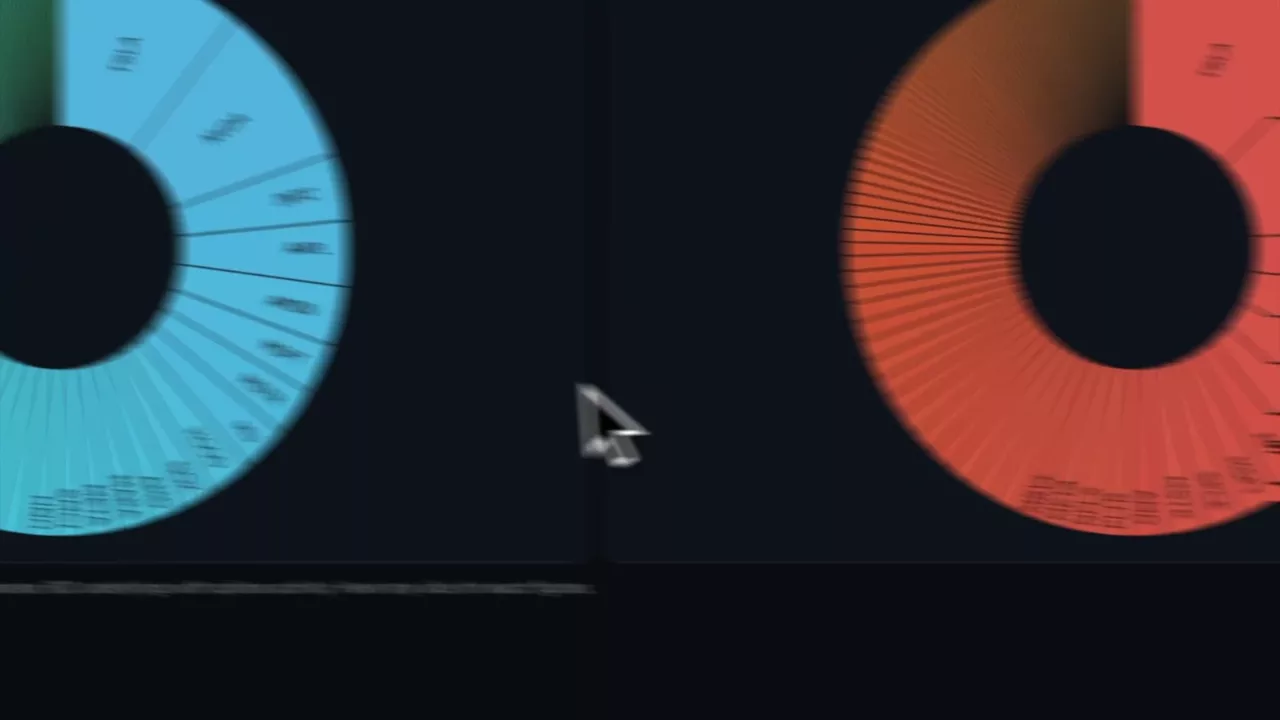 0:48
Where the top 100 names’ call and put volume actually sits
Two pie charts splitting call and put volume across the hundred largest option markets, with a toggle to exclude indices and the biggest ETFs.
TSLA · NVDA · MU · INTC
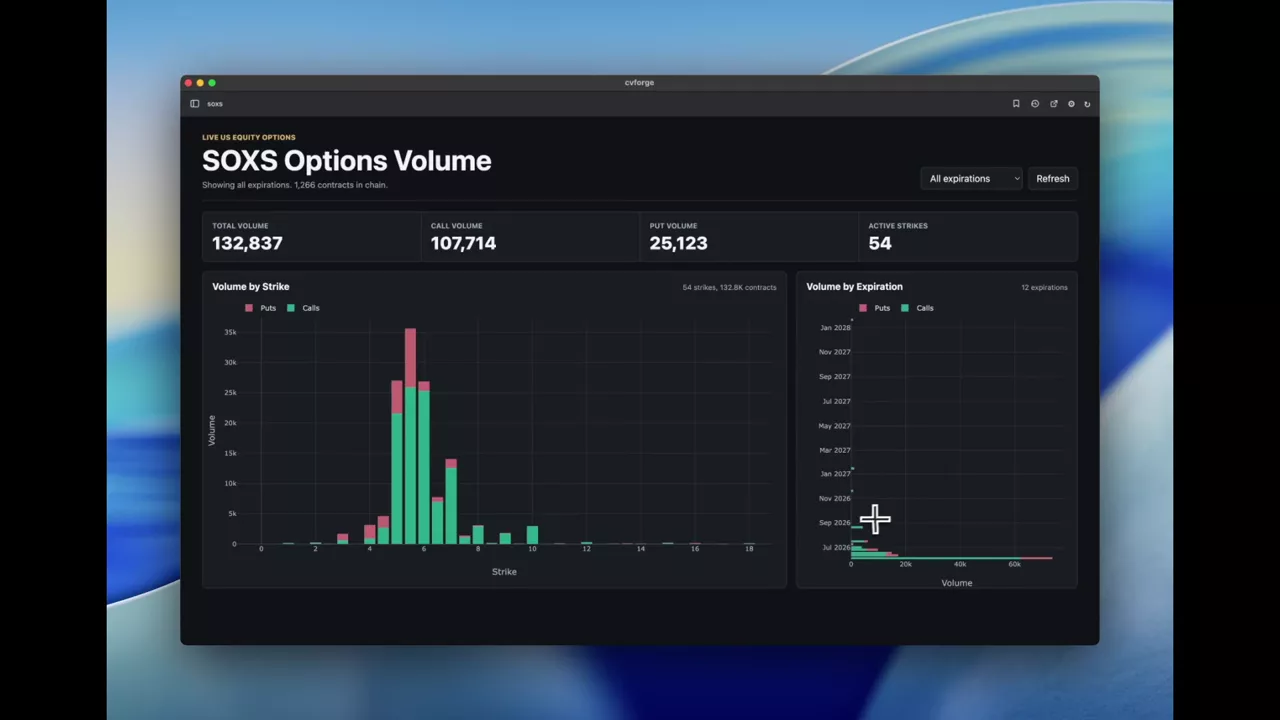 0:36
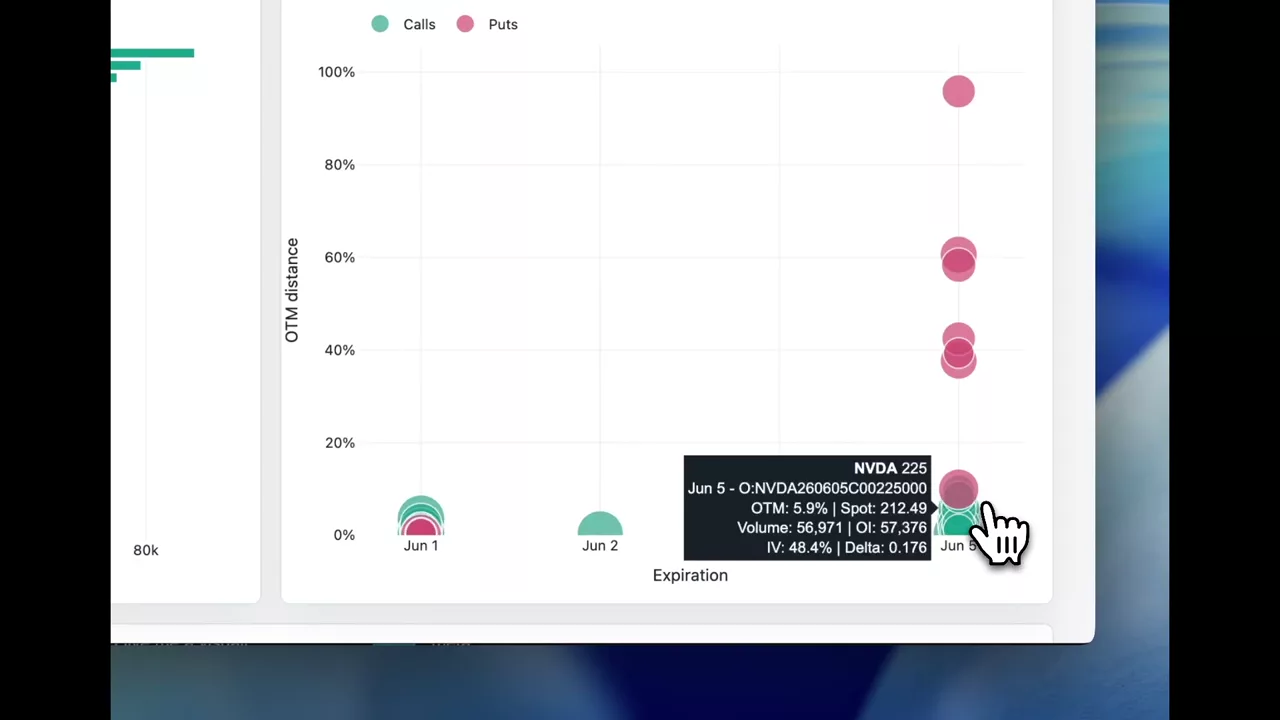
SOXS volume by strike and by expiration
The two basic cuts of a chain’s activity as plain bar charts — where volume sits across strikes, and how it splits across expirations.
SOXS
 0:50
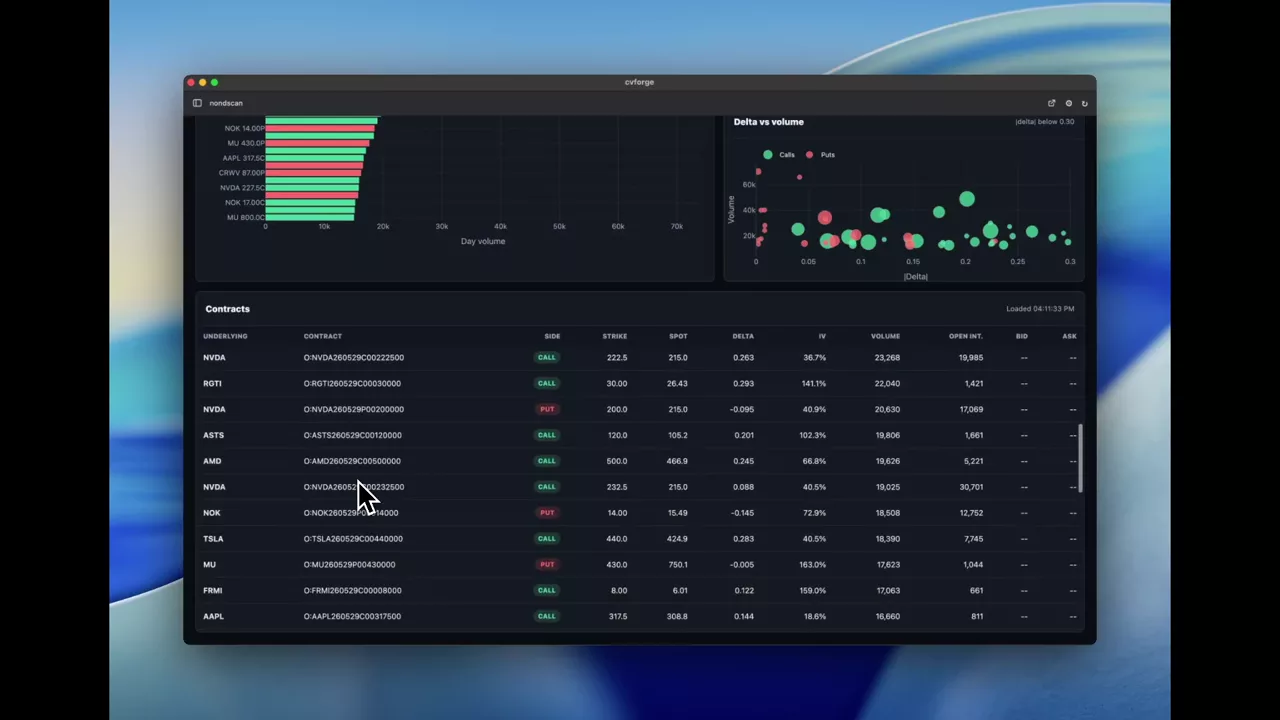
The most active out-of-the-money options for the coming week
Top OTM calls and puts across the next seven days by session volume, ranked, with an expiration-against-distance bubble chart to show how far out the activity sits.
 1:06
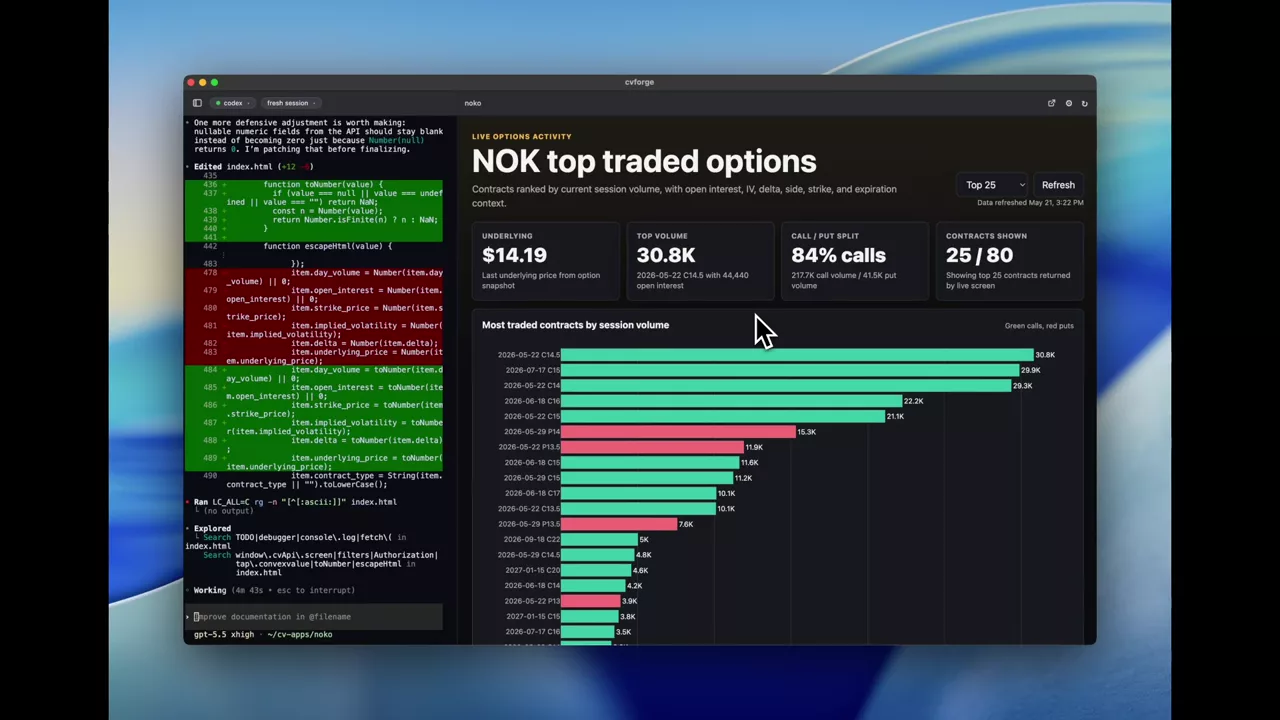
Next week’s most traded single-stock options under 0.30 delta
Top contracts for next week’s expiration, ETFs excluded and restricted to below 0.30 delta, which is where cheap-optionality activity concentrates.
 1:16
NOK’s most traded options, three ways
A bar chart of the top NOK contracts, volume by expiration, and volume against open interest with implied volatility as bubble size — from one short prompt.
NOK
Custom option screeners
Scans whose filters are not on any fixed menu: written as a sentence, ranked how you asked.
Read the guide →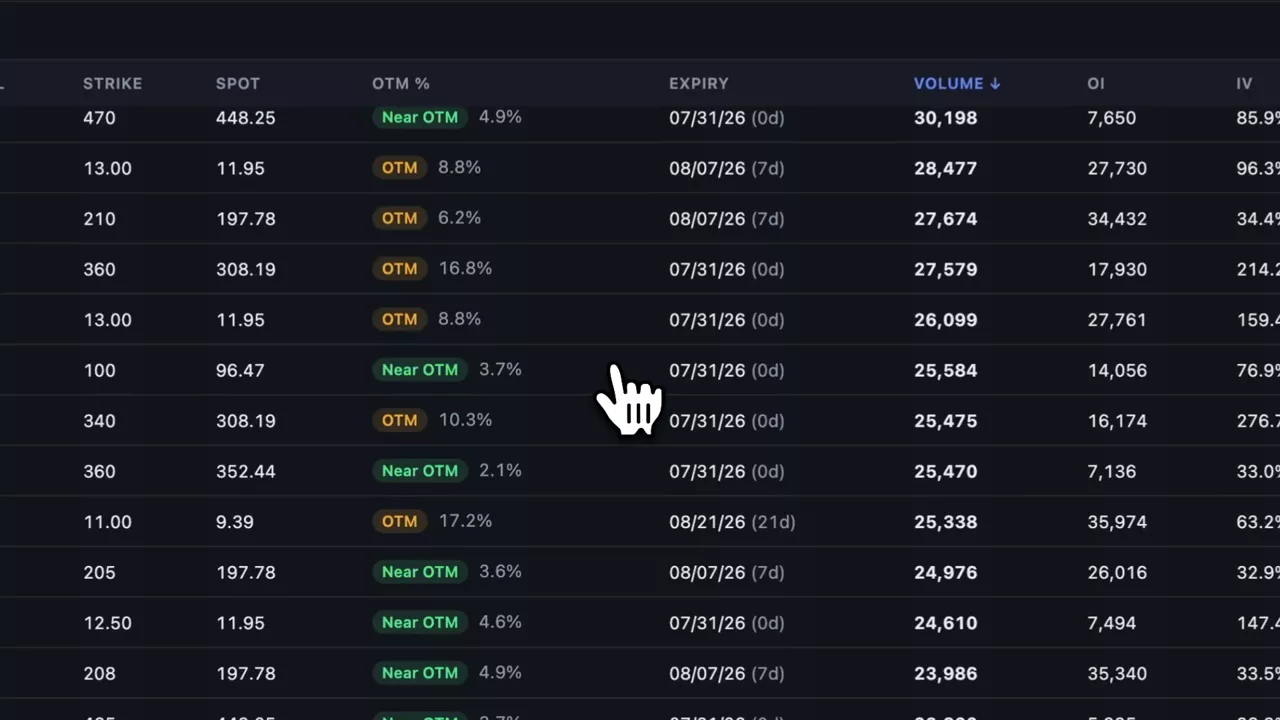 0:28
Ranking the furthest out-of-the-money calls traded
The session's call volume sorted by how far from spot it printed rather than by size, with ETFs excluded on a toggle so single names are what reaches the top.
 0:29
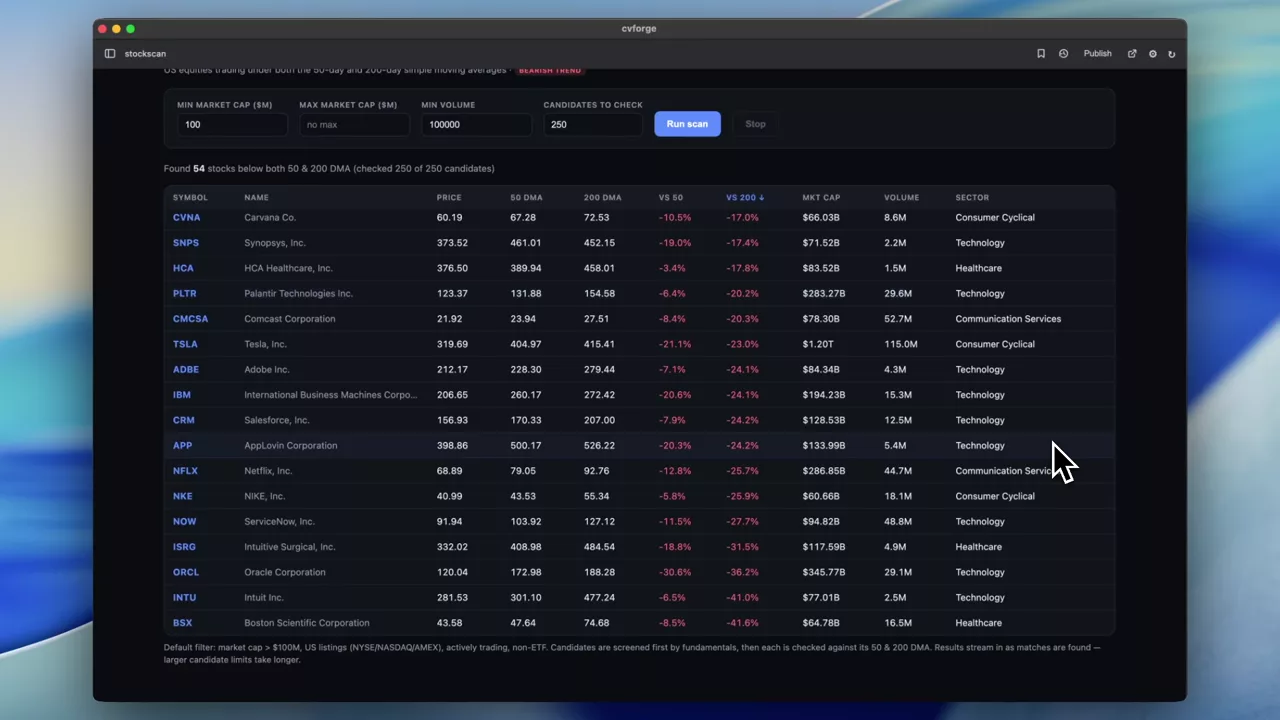
Screening stocks below both their 50-day and 200-day averages
A stock screener for names trading under both moving averages at once, with a market-cap floor to keep microcaps out of the list.
 1:17
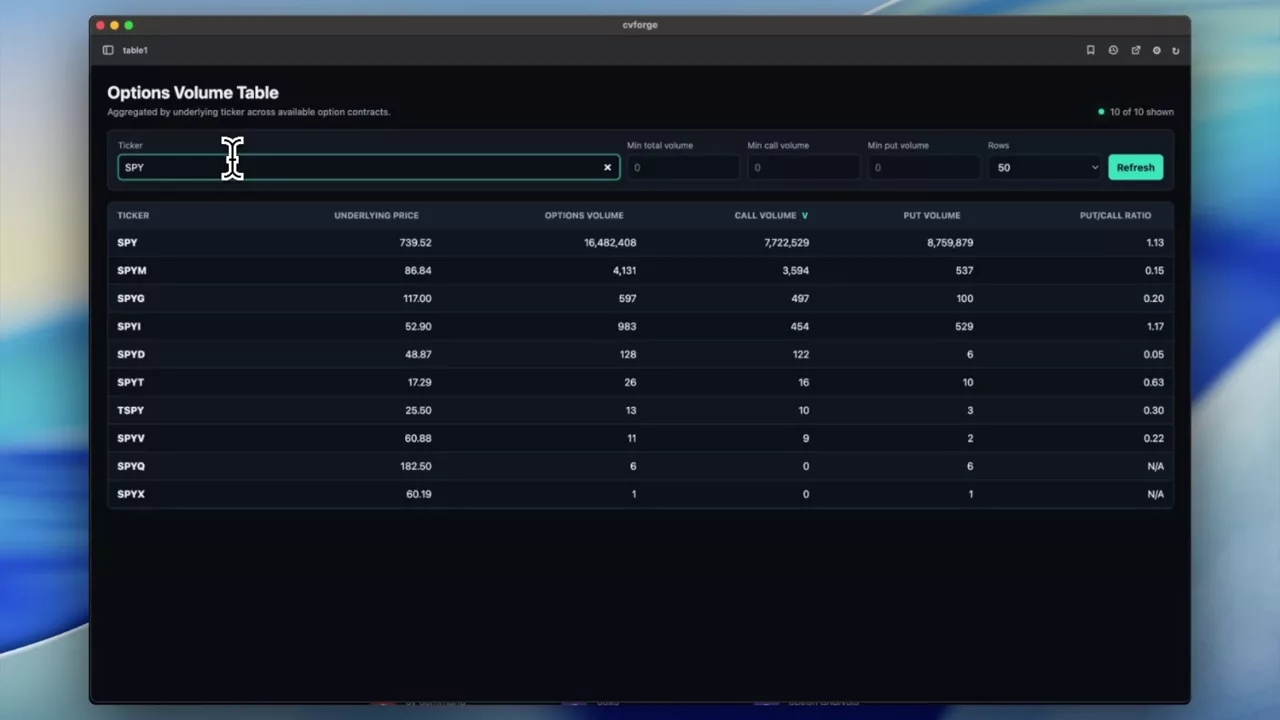
A sortable put/call volume table across underlyings
Ticker, spot, total option volume, call and put volume and the put/call ratio in one sortable table, defaulting to the heaviest call volume.
 1:03
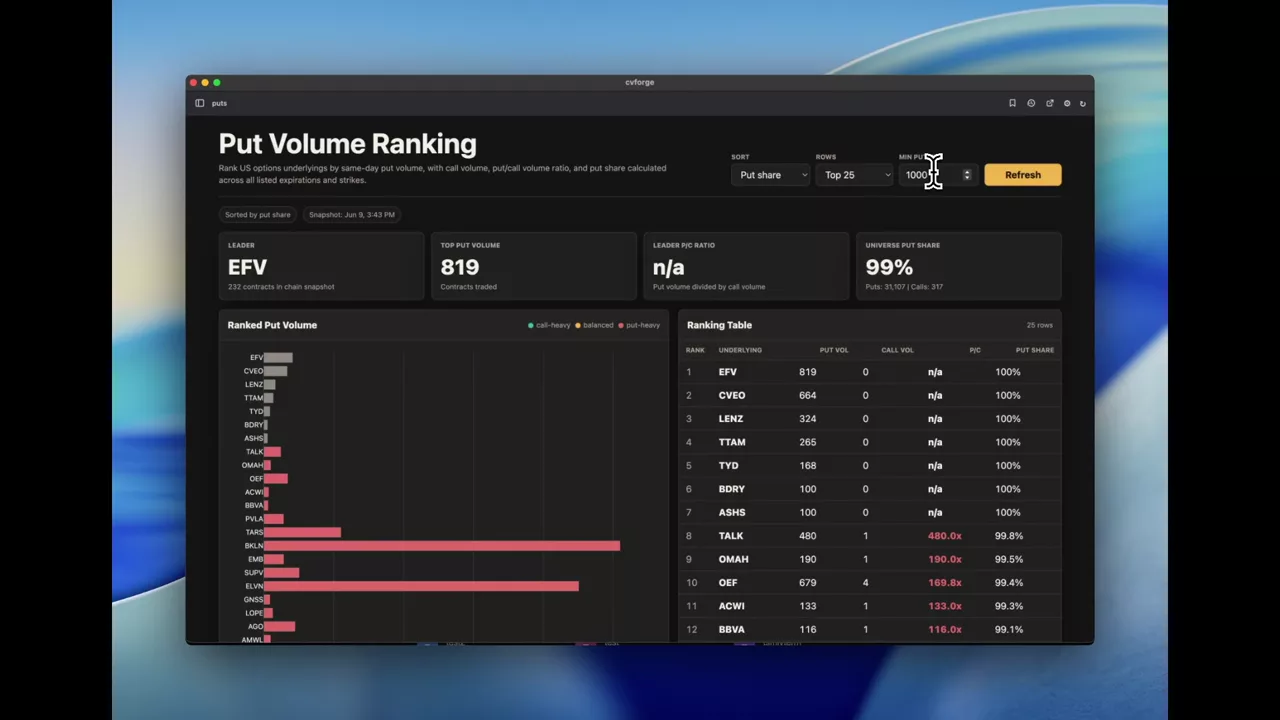
Ranking underlyings by put volume, absolute and relative
Two rankings side by side: the largest put volume in contracts, and the highest put-to-call ratio — which almost never surface the same names.
 1:45
Scanning for stocks with more call volume than put volume
A one-sentence scan across U.S. underlyings for names whose call volume beat put volume today, and the ratio that ranks them.
Implied probability and expected move
What the option chain implies about where a name can be by a date — cones, distributions and expected-move boards.
Read the guide →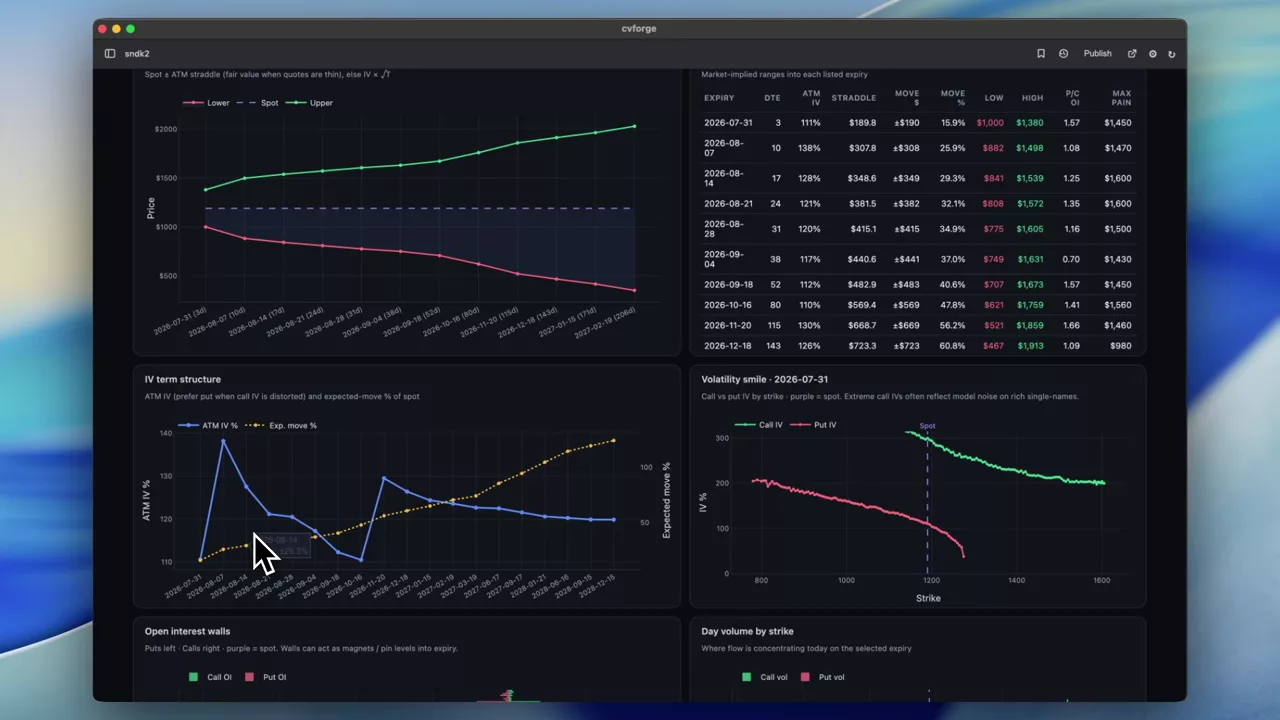 0:32
What SNDK options imply, expiry by expiry
The straddle-implied band for every listed expiry on Sandisk, with term structure, smile, open interest walls and max pain read off the same chain.
SNDK
 0:28
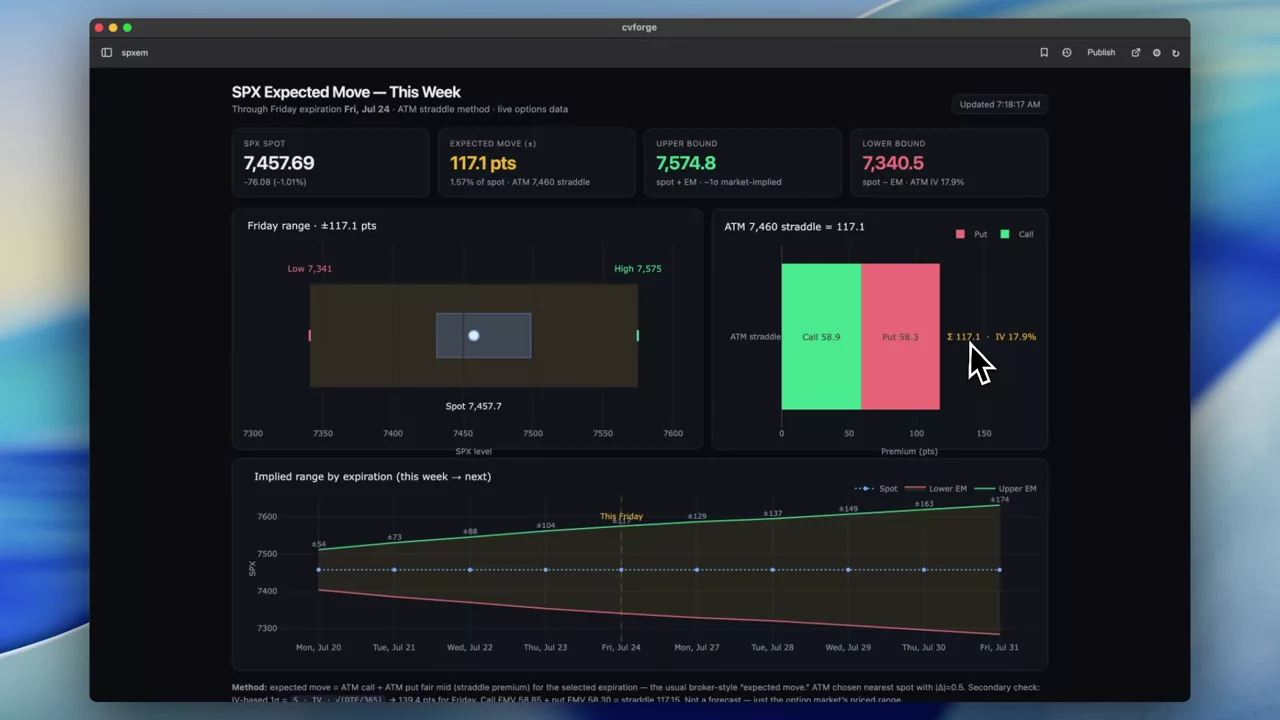
This week’s SPX expected move and its bounds
A stripped-back read of the current week: SPX spot, the expected move implied by this week’s expiration, and the upper and lower bounds it sets.
SPX
 0:29
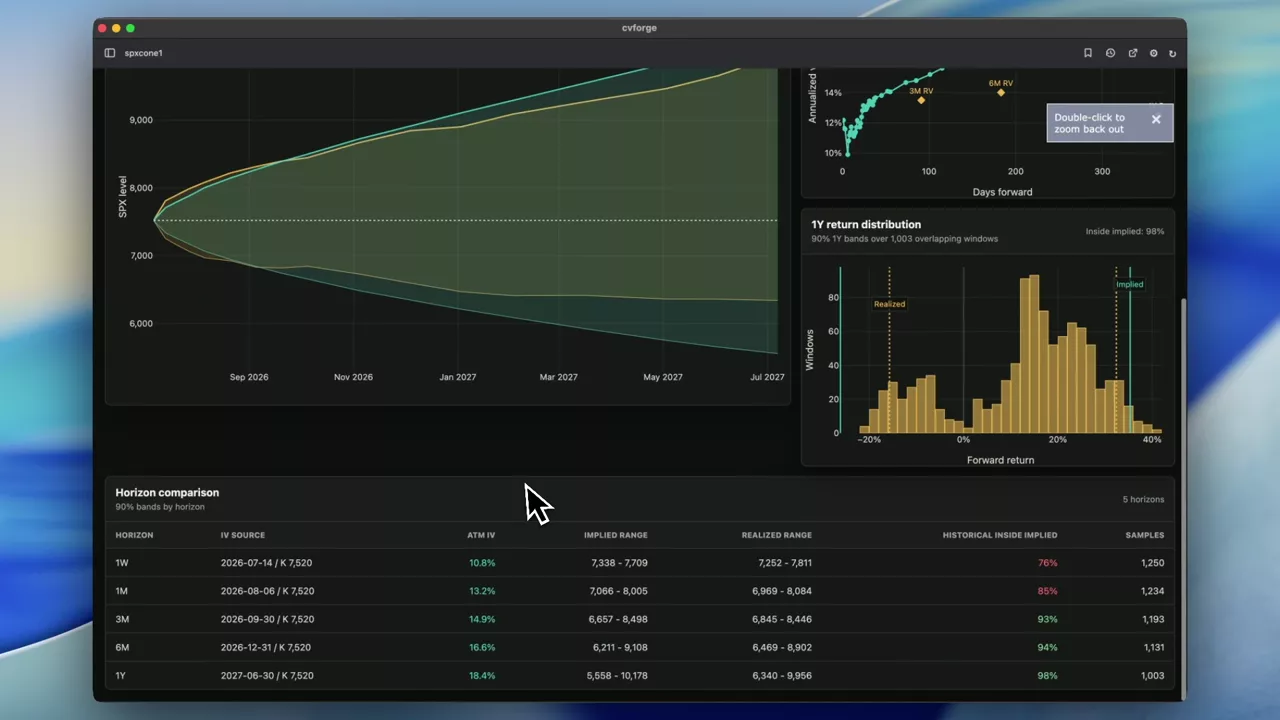
A year of SPX implied cones against realised outcomes
Realised against implied probability cones for SPX out to a year, long enough for the volatility risk premium to show up as a pattern rather than a coincidence.
SPX
 0:36
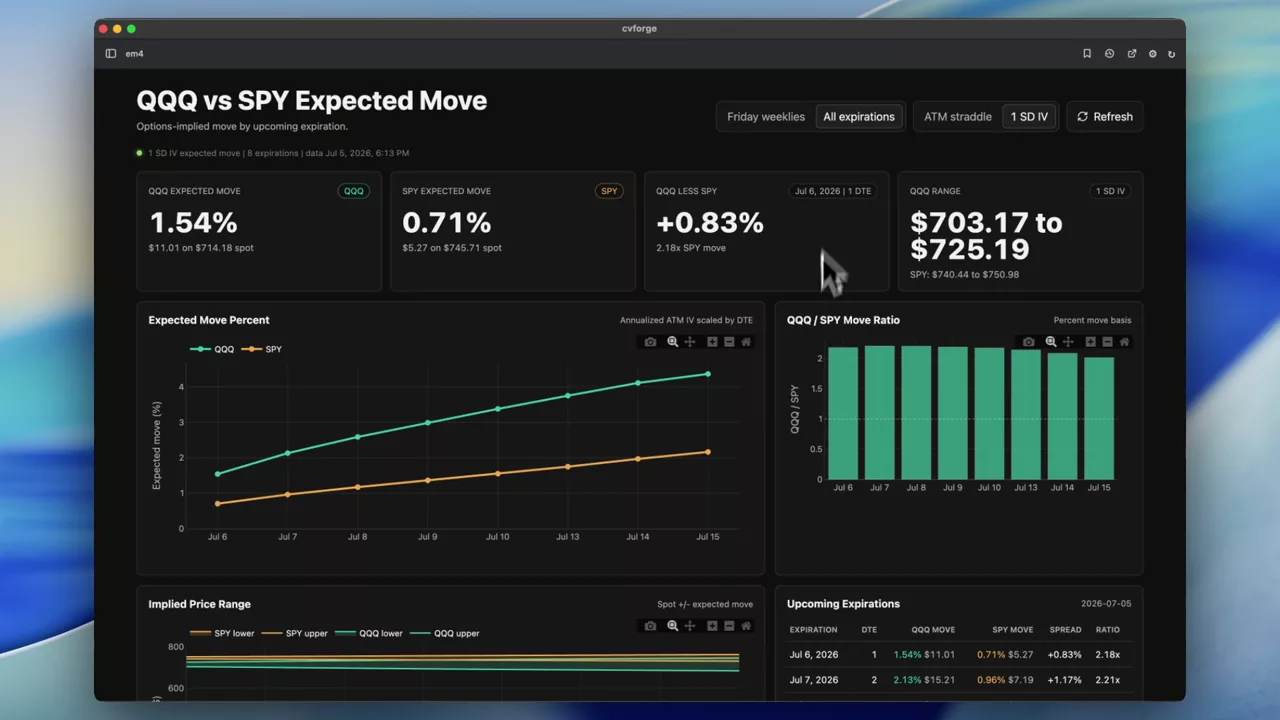
QQQ against SPY: whose weekly expected move is larger
The coming weeks’ implied expected move for QQQ and SPY side by side, which is the cleanest read on how much more movement is priced into tech.
QQQ · SPY
 0:24
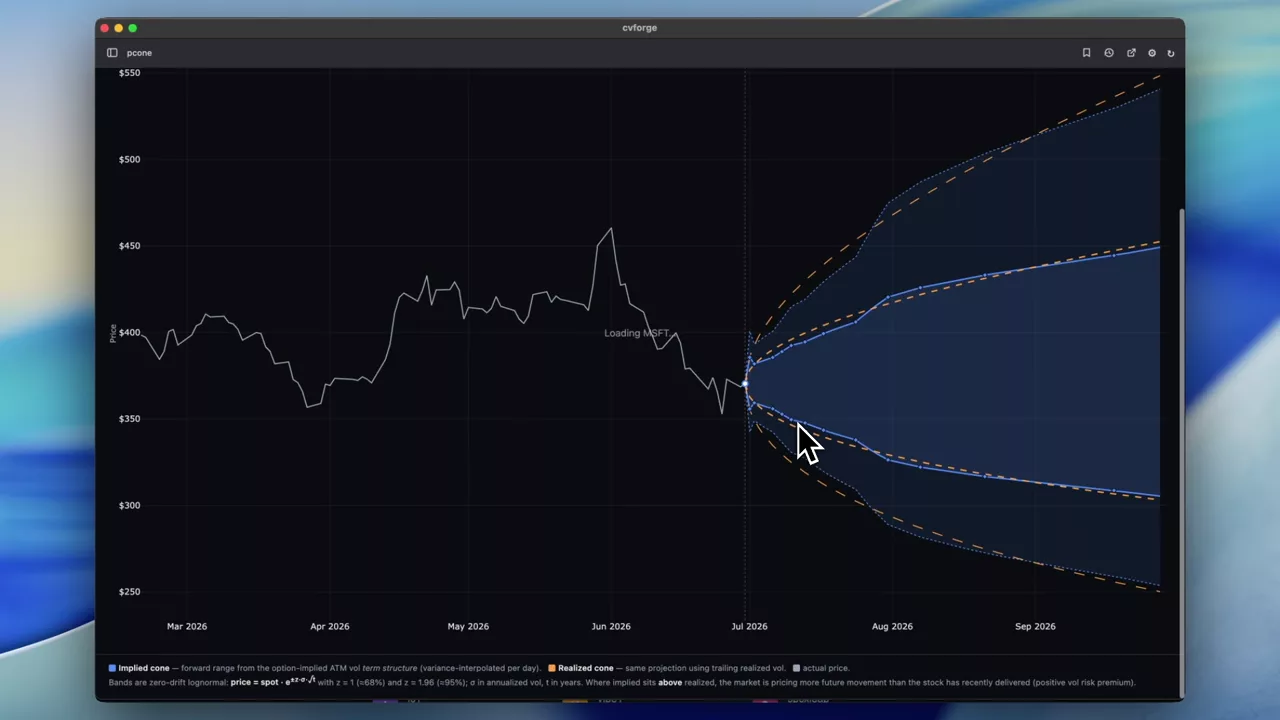
MSFT: implied cones against what actually happened
Implied probability cones for MSFT drawn alongside realised outcomes, which turns a forward-looking band into something you can score after the fact.
MSFT
 0:59
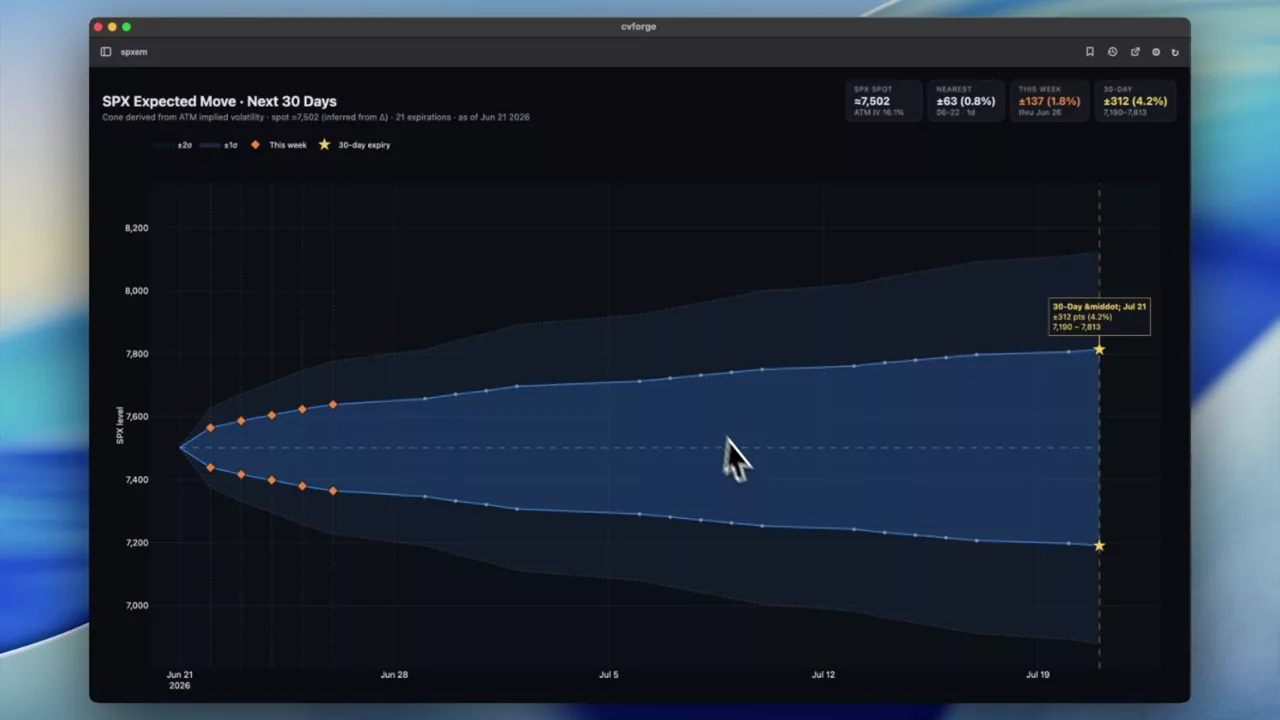
SPX expected move over 30 days, with expiry markers
The 30-day expected move for SPX with markers on this week’s expirations and the 30-day expiration, so the near-term and the horizon are on the same picture.
SPX
 0:40
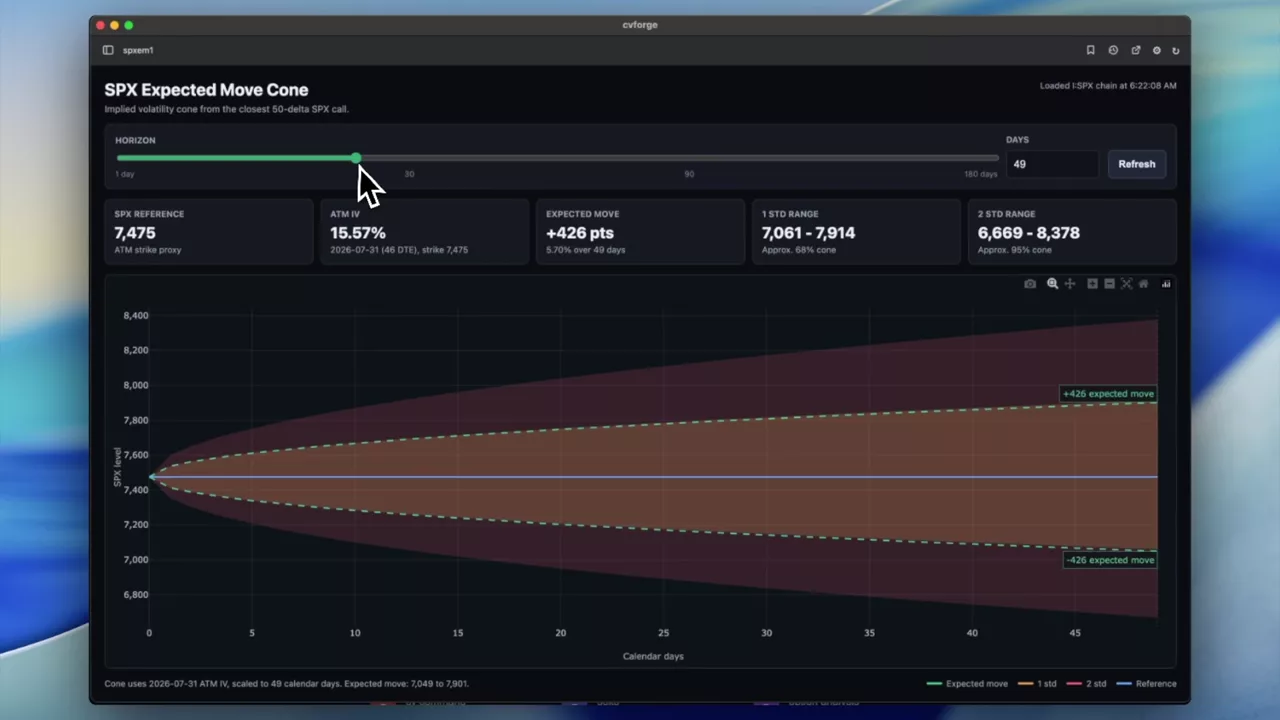
A controllable SPX expected-move and cone chart
Expected move and probability cone for SPX with the horizon under your control — defaulting to 30 days, adjustable to whatever window you are trading.
SPX
 0:55
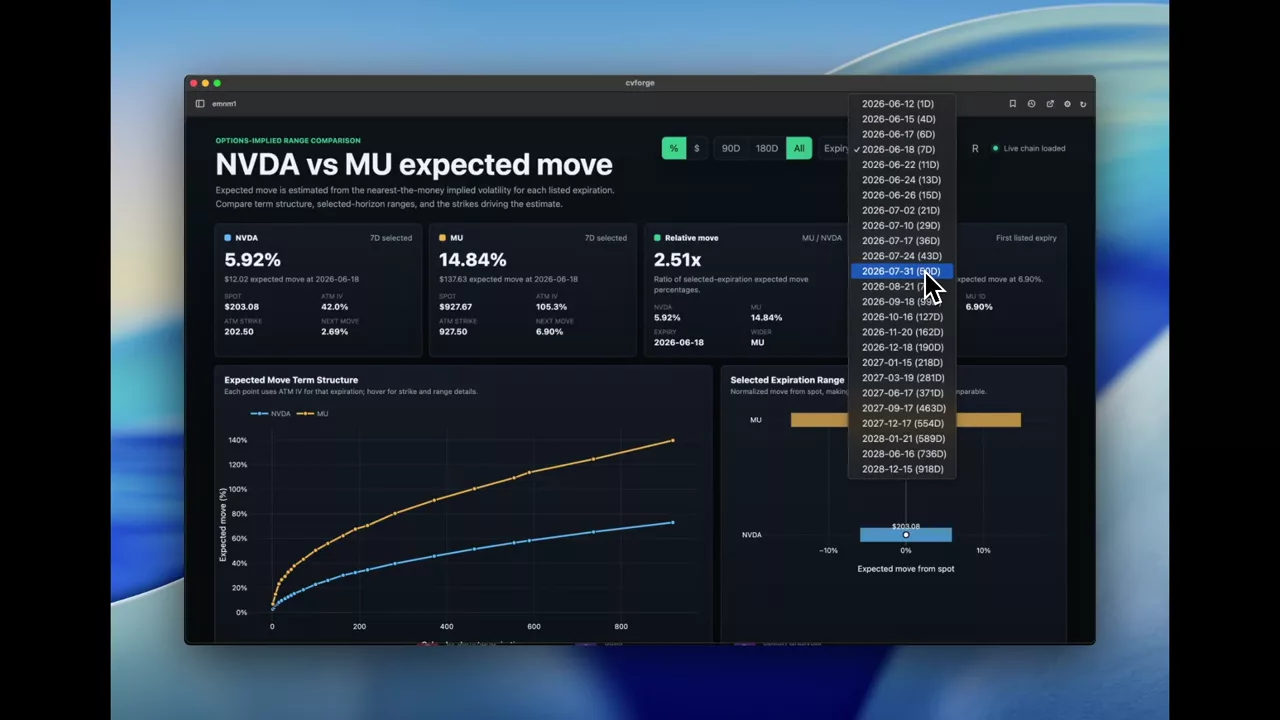
Comparing expected move: NVDA against MU
Expected move for two semiconductor names side by side, derived from ATM implied volatility and shown in both dollar and percentage terms.
NVDA · MU
 1:03
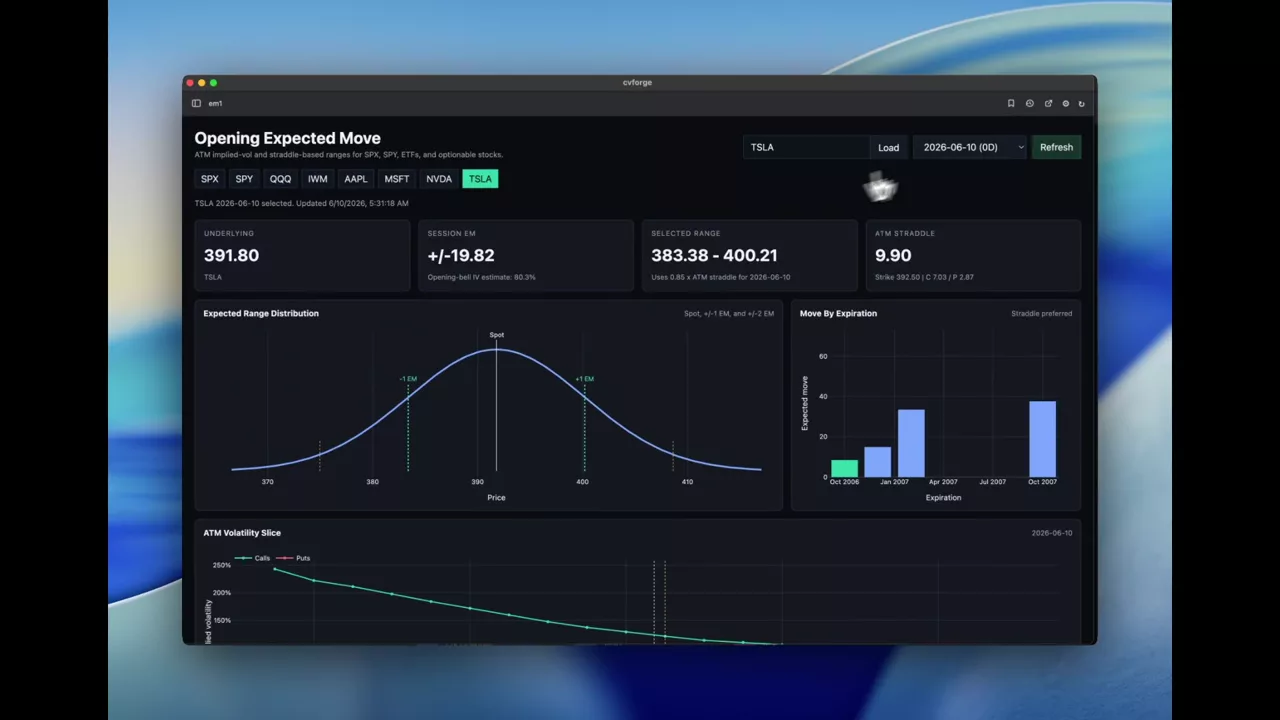
A session-open expected move board for SPX, SPY or any stock
Expected move computed at the US open for whichever symbol you point it at, with the ATM straddle price, implied range and an expiration ladder.
 0:32
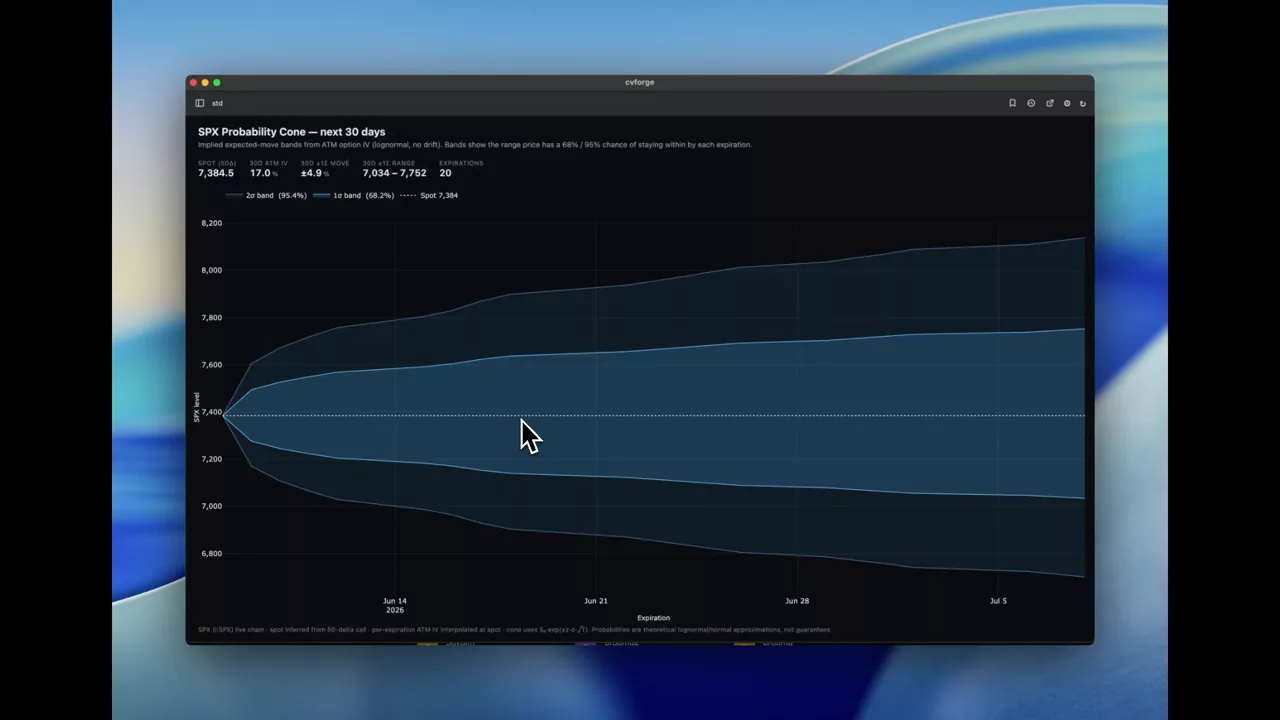
Building an SPX probability cone at one and two standard deviations
A 30-day SPX probability cone drawn from option prices, with the one and two standard deviation bands that bracket most outcomes.
SPX
 1:04
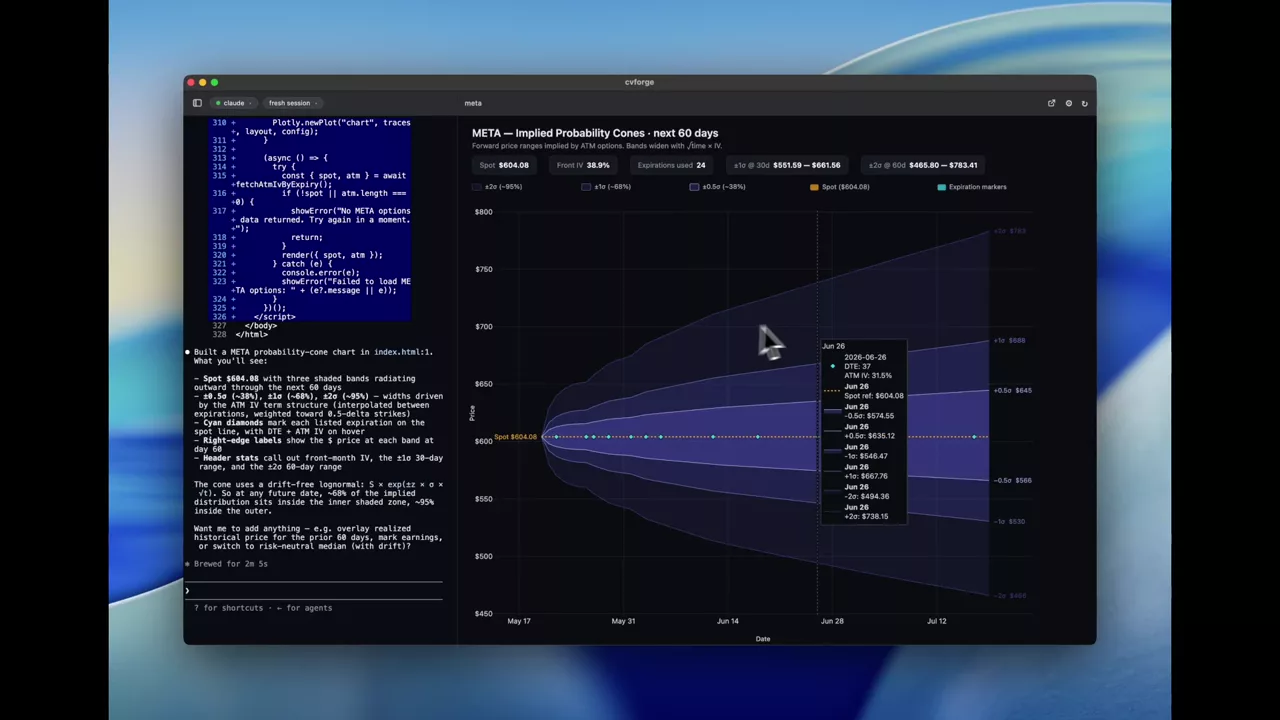
META implied price ranges over the next 60 days
Sixty days of implied probability ranges for META drawn as nested cones, so the price bands the option market is pricing are readable at a glance.
META
 0:43
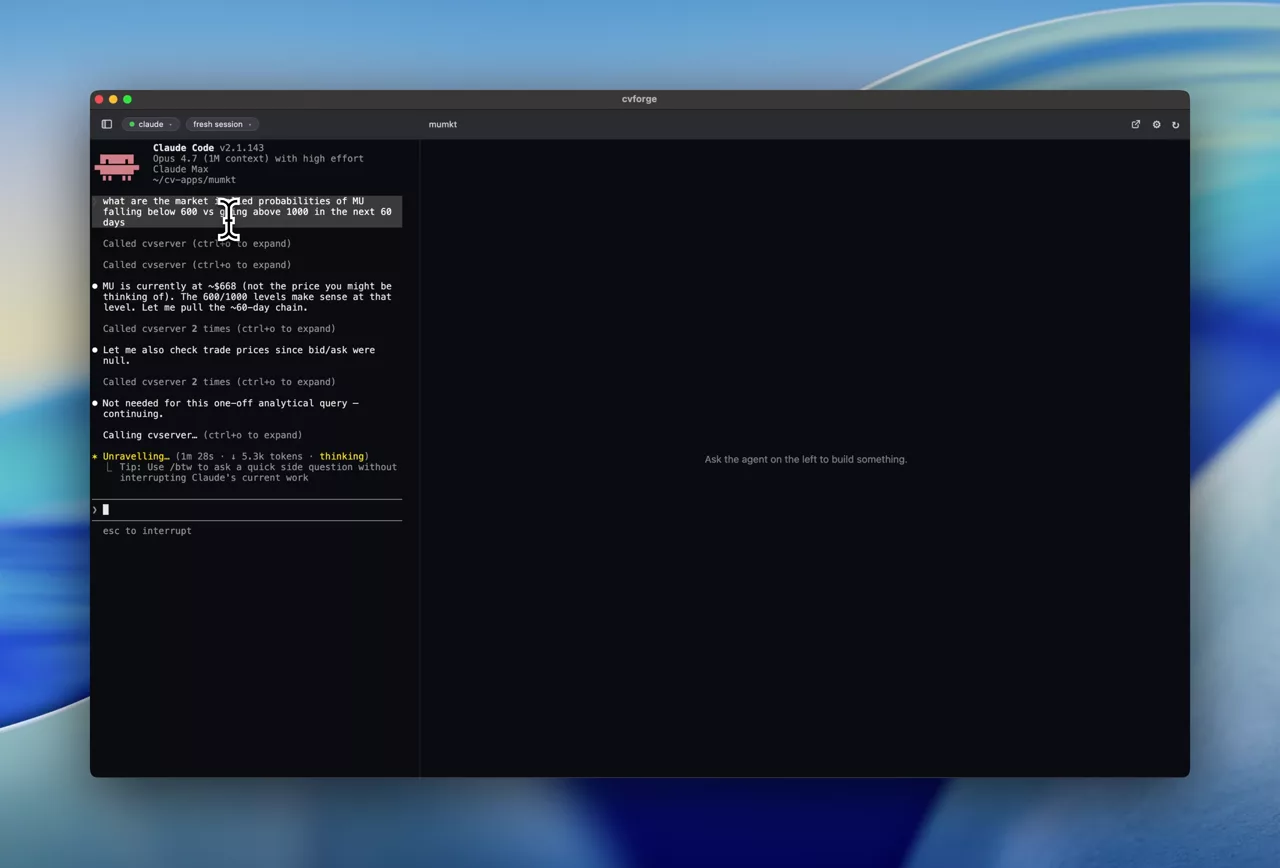
MU below 600 or above 1000: two-sided implied odds
Both tails priced at once — the implied probability of MU falling below 600 against rising above 1000 over 60 days — which is where skew becomes concrete.
MU
 1:59
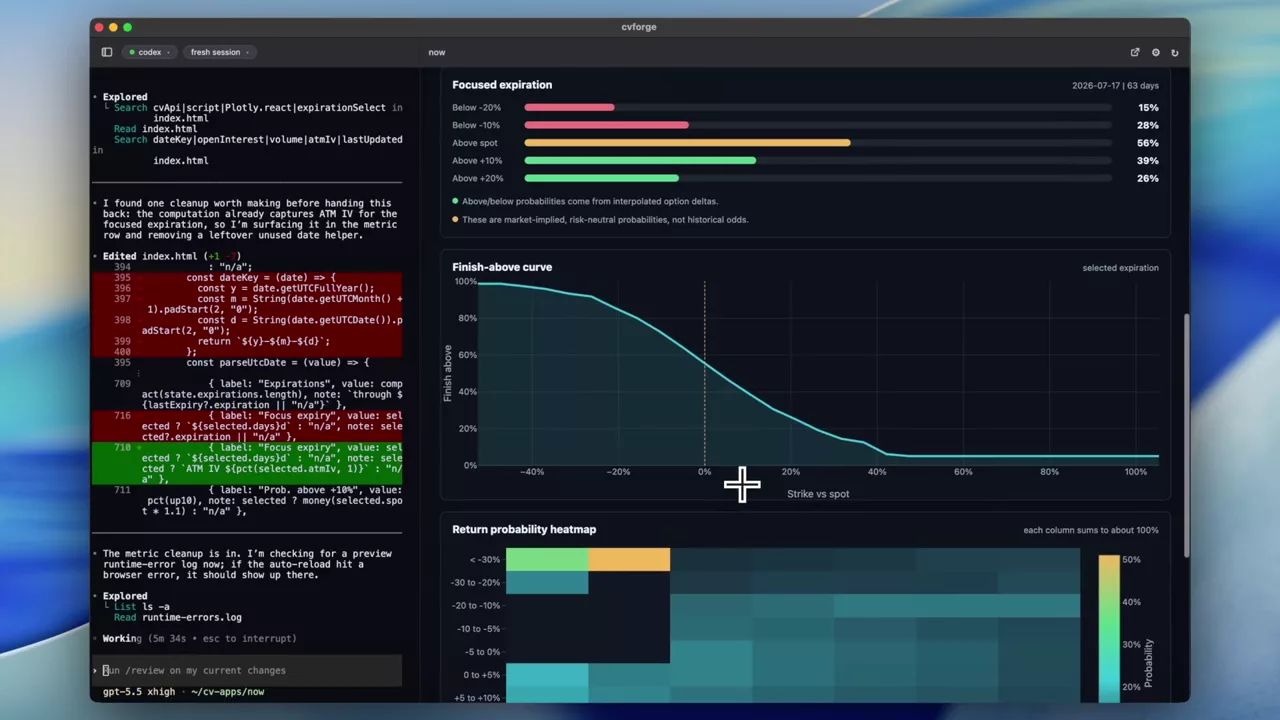
ServiceNow implied probabilities over 90 days
The market-implied probability distribution for NOW across the next 90 days, drawn as an intuitive graphic rather than a table of option prices.
NOW
 0:32
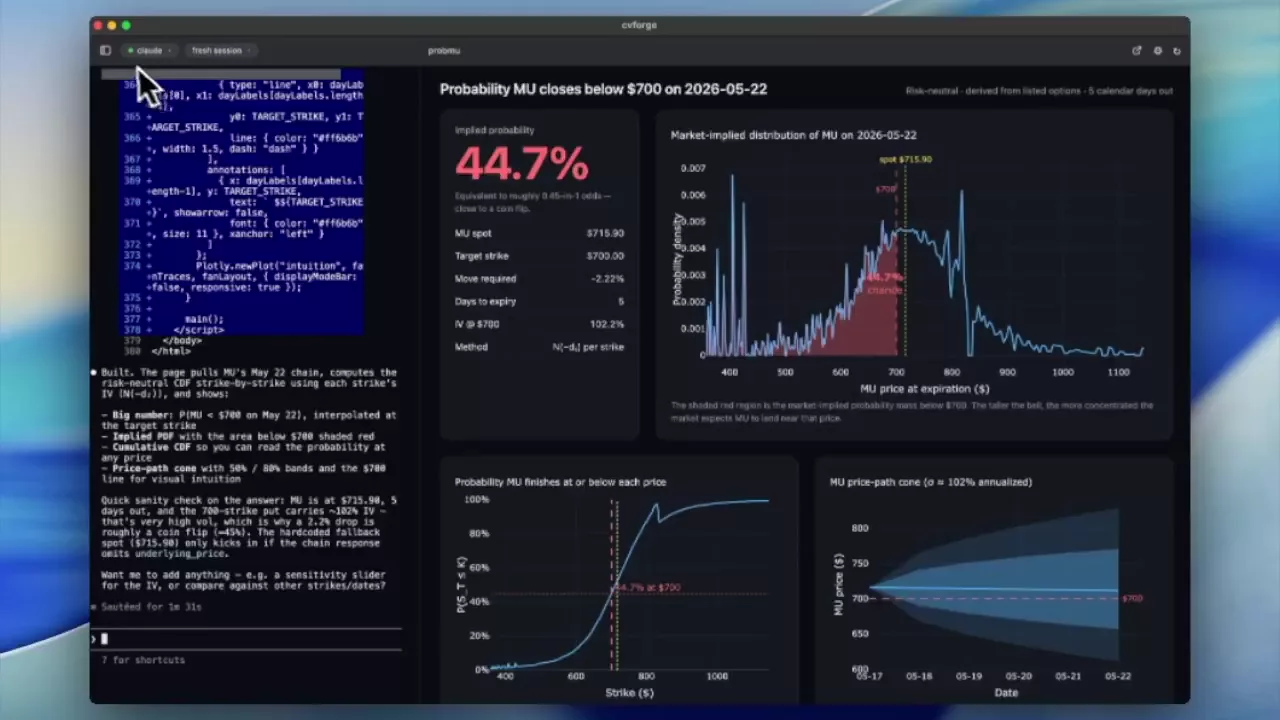
The chance of MU falling below 700 by a given date
A direct question — what is the probability MU is below 700 by May 22 — answered from the option chain, with the implied distribution and price-path cone drawn out.
MU
3D implied volatility surfaces
The whole surface at once, across strikes and expirations, including two-ticker overlays.
Read the guide →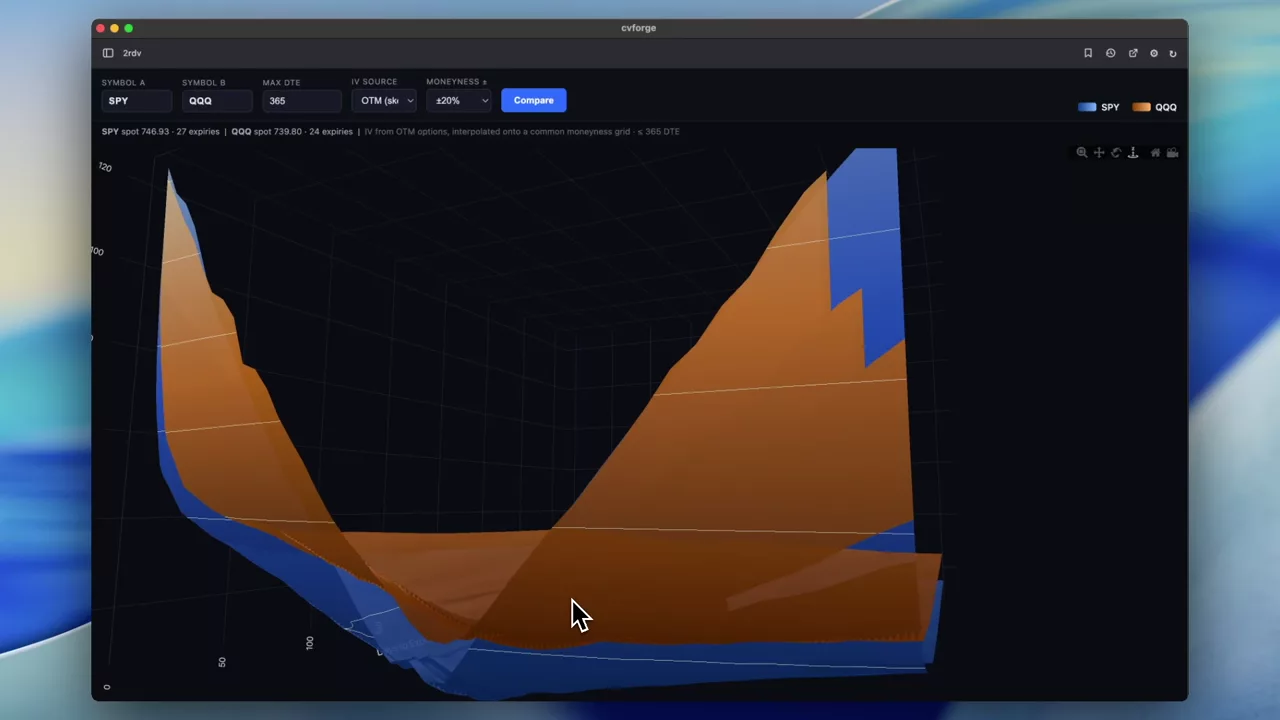 0:50
Comparing two volatility surfaces in the same 3D space
SPY and QQQ surfaces rendered together so the difference between two closely related indices is visible as a gap rather than inferred across two charts.
SPY · QQQ
 0:58
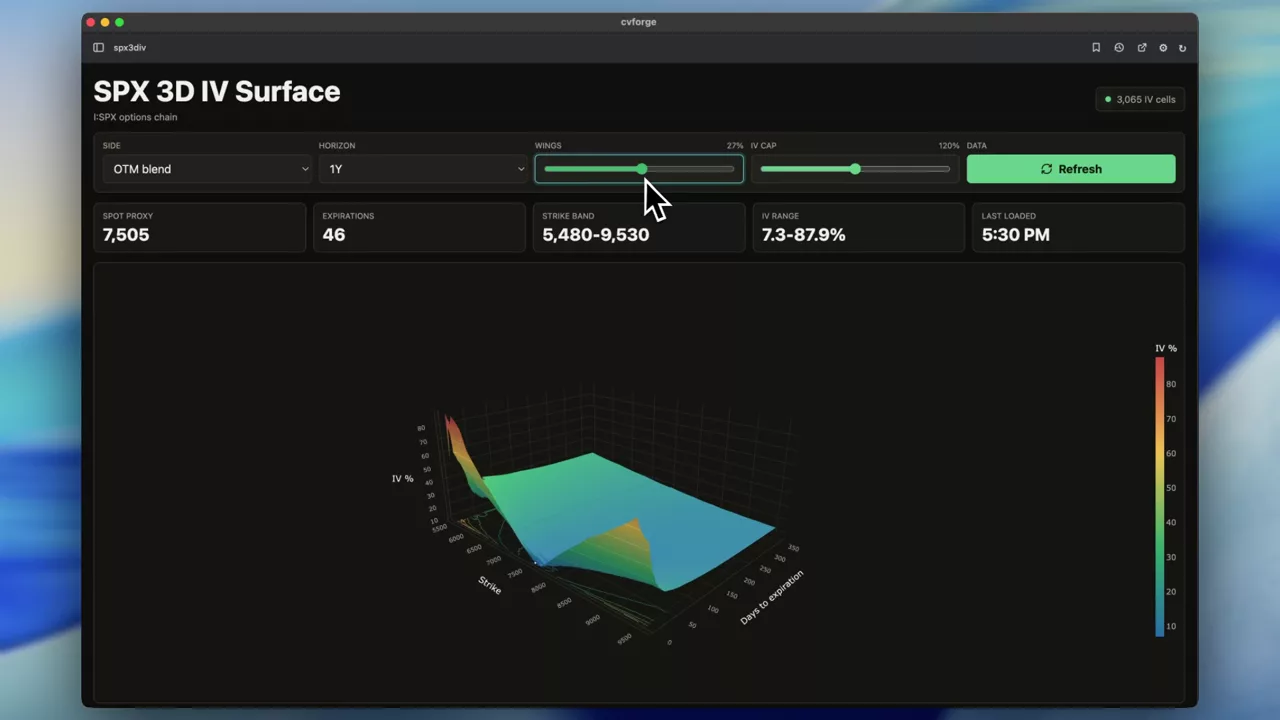
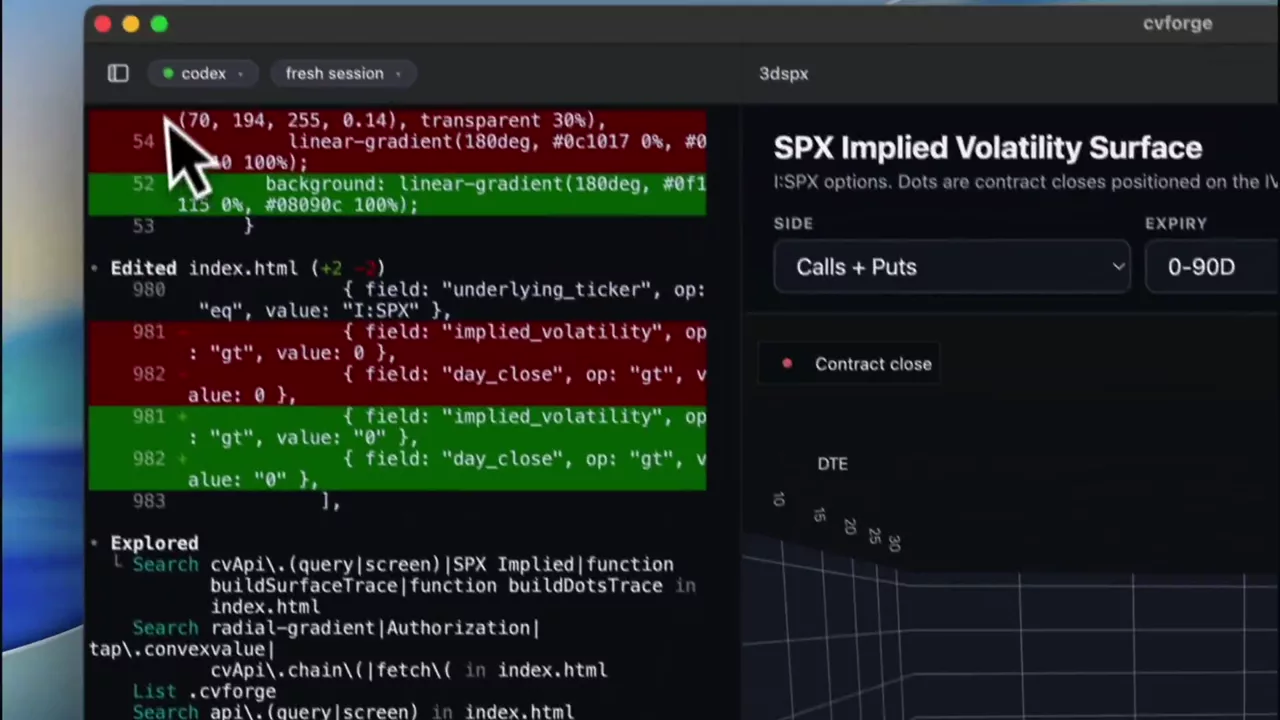
SPX 3D IV surface: six words, one working chart
"create a 3d iv surface for $SPX" produces a full rotatable surface — the shortest route from an idea to a working volatility chart in the library.
SPX
 1:15
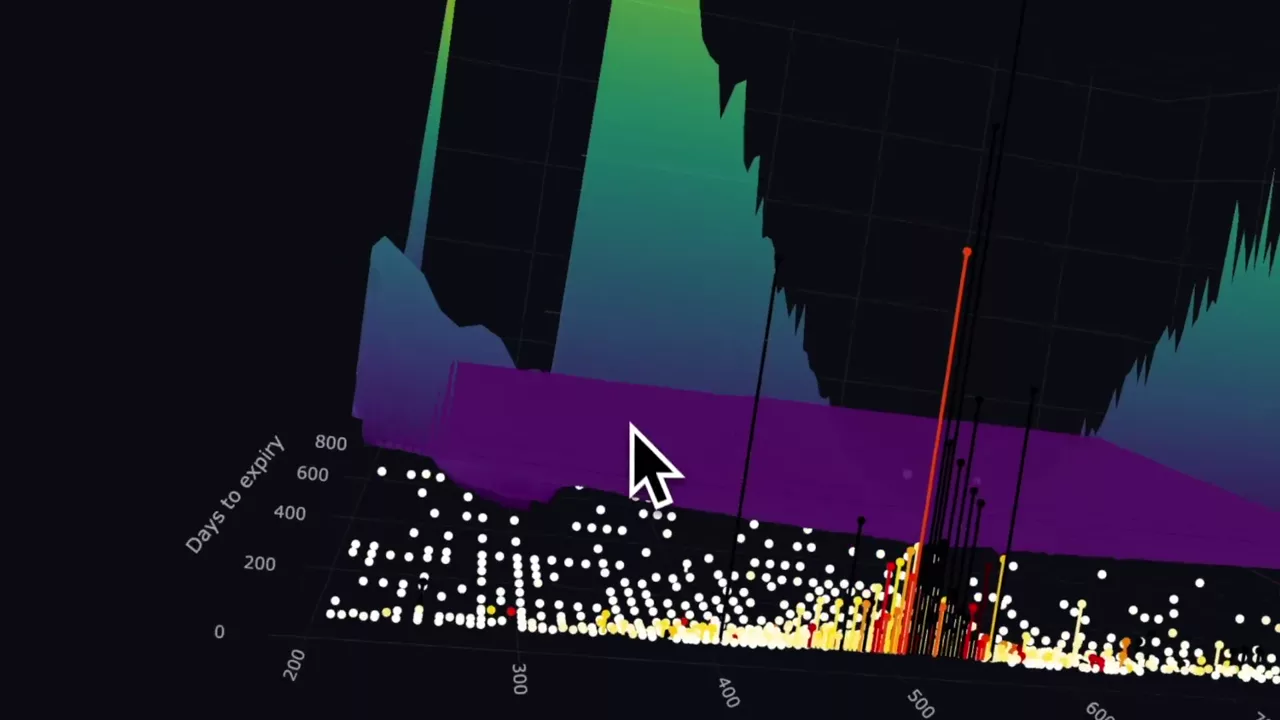
AMD IV curve with a volume/OI overlay you can filter
A 3D AMD volatility curve with volume-against-open-interest bars overlaid and a control to hide ratios below a threshold, so activity and pricing appear together.
AMD
 1:30
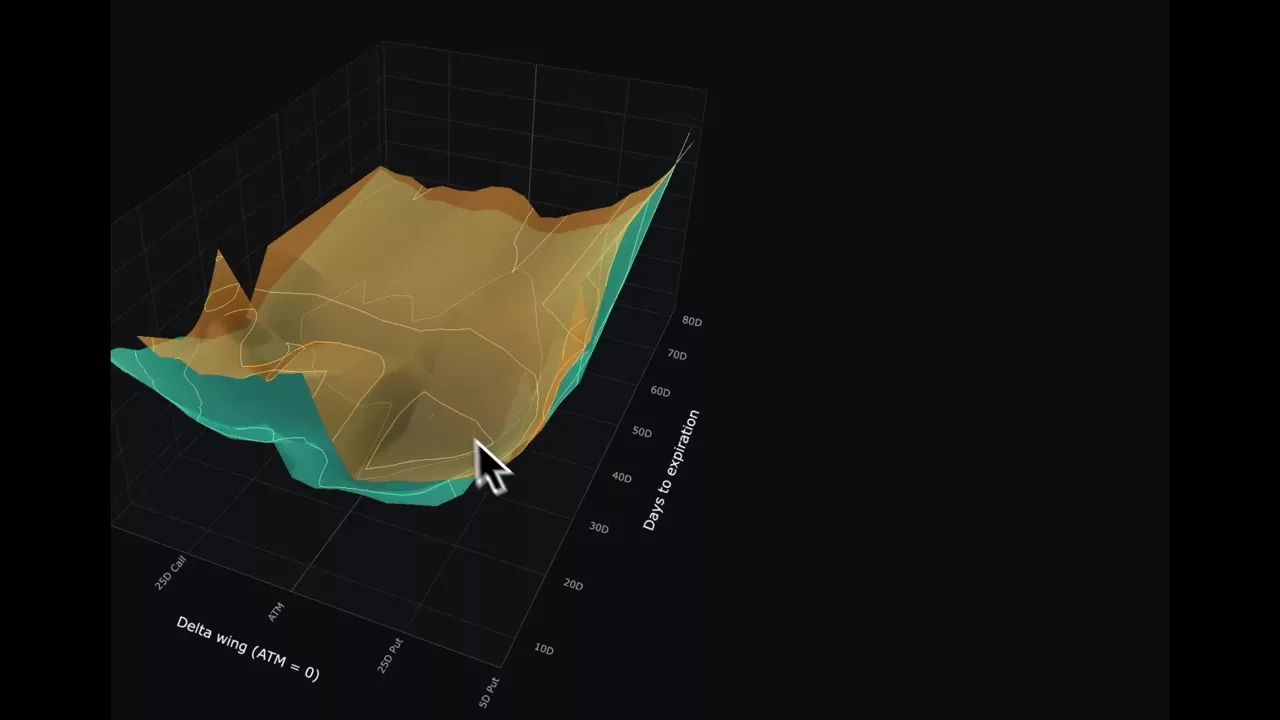
SPY against QQQ on delta and time, overlaid on one axis
The same two-surface comparison built on delta and time to expiry instead of strike, which is what makes two differently priced indices directly comparable.
SPY · QQQ · AAPL · JPM
 2:05
The SPX volatility surface as points in 3D space
SPX implied volatility across strikes and expirations plotted as a point cloud rather than a mesh — every dot is a real listed contract, with no interpolation.
SPX
 0:19
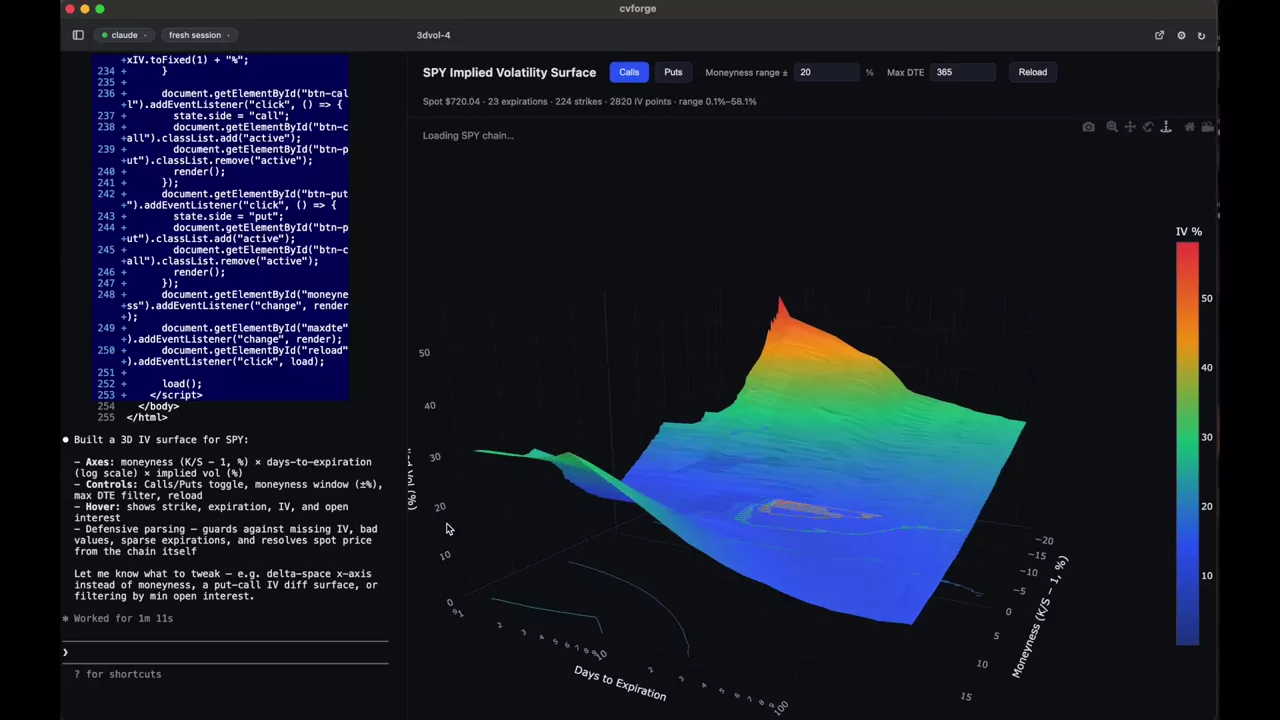
A 3D SPY implied volatility surface in one line
"Create a 3D visualization of the $SPY IV Surface" — the entire prompt — returns a rotatable surface across every listed strike and expiration.
SPY
Skew and IV term structure
How volatility is priced across strikes and out through time, and what a steep or inverted curve is telling you.
Read the guide →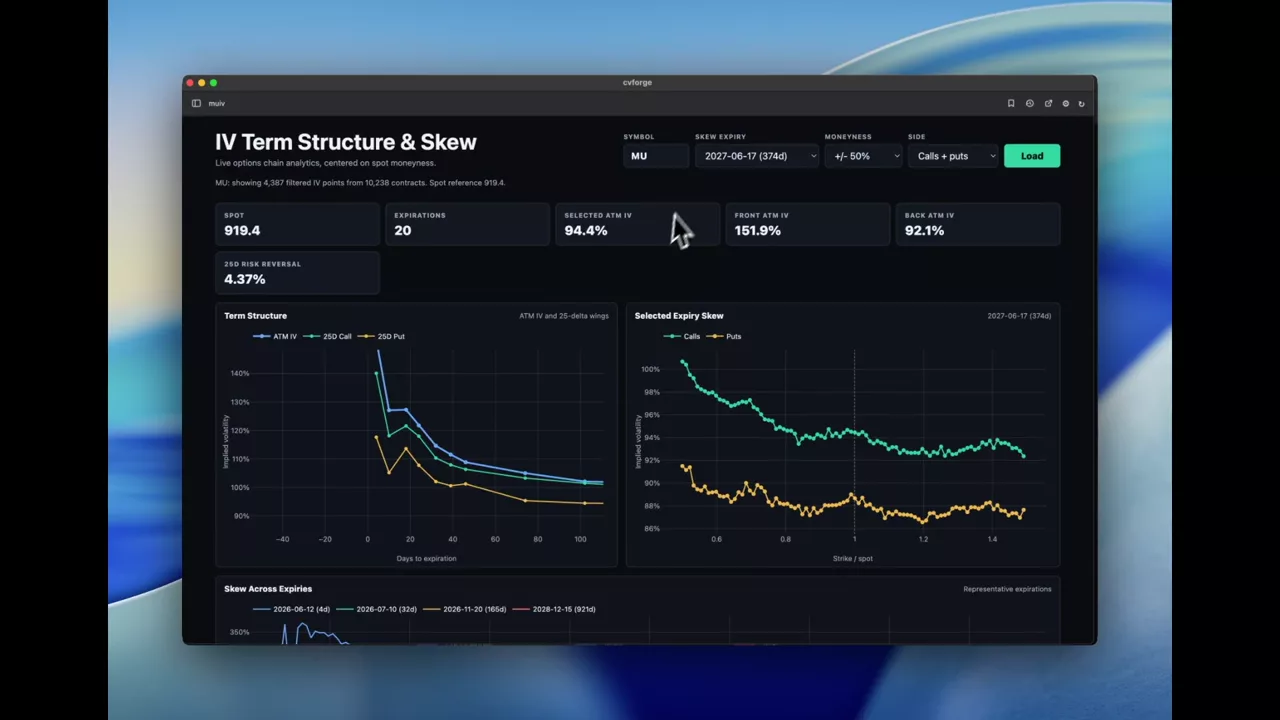 0:48
MU IV term structure and skew in one view
Implied volatility across expirations and across strikes for MU on a single screen, built to take any symbol rather than being hard-wired to one.
MU
 1:10
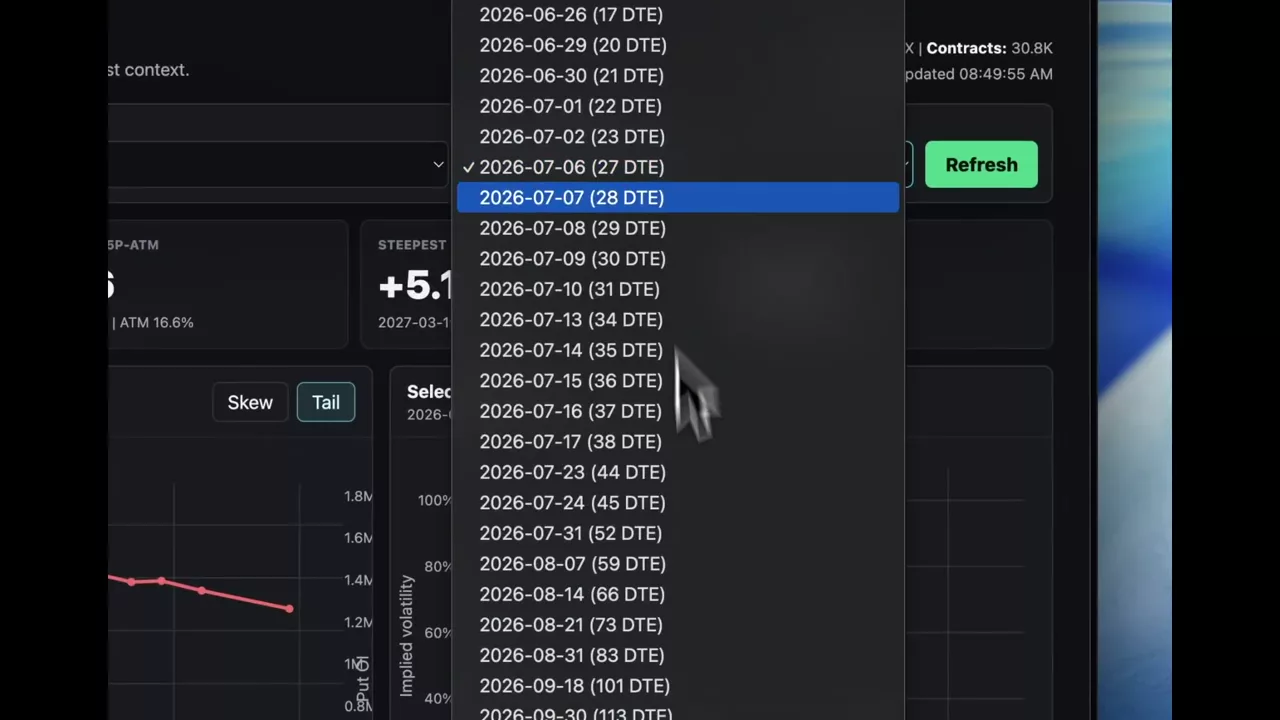
SPX put skew across expirations, 25-delta against 10-delta
Implied volatility for 25-delta and 10-delta SPX puts at every expiration, with open interest alongside and a toggle for the difference between them.
SPX
 0:59
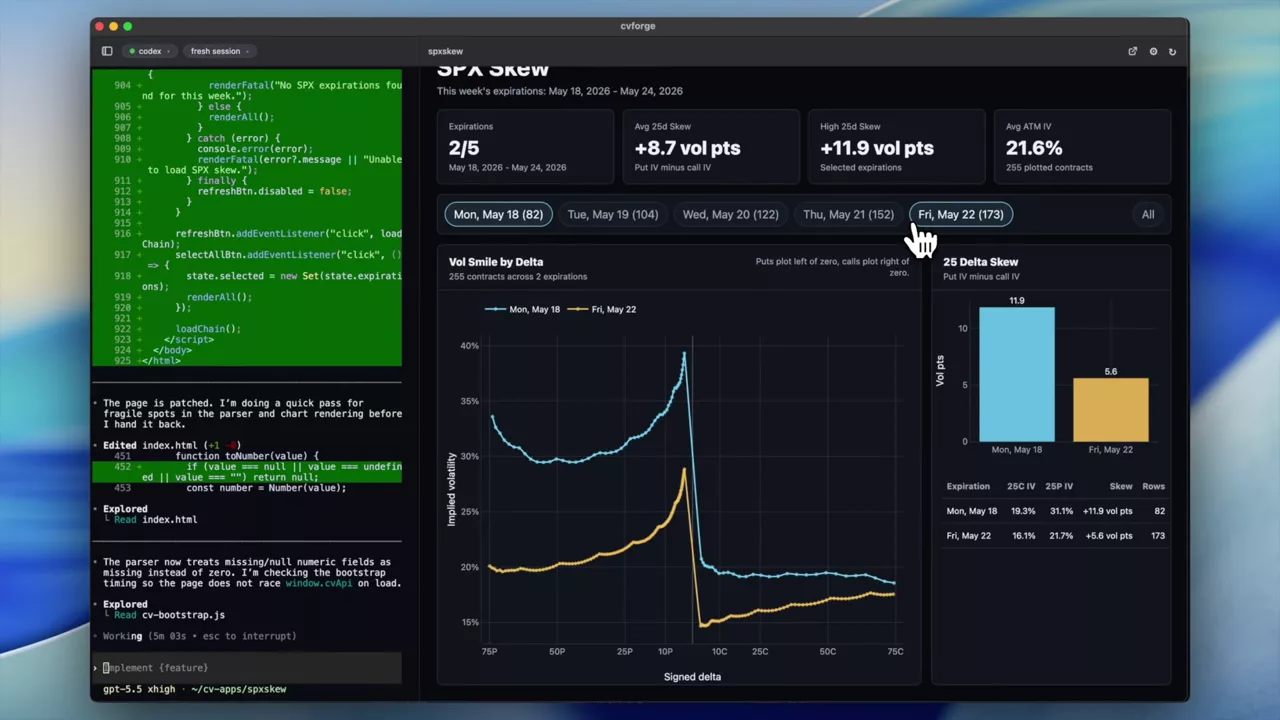
SPX skew for this week’s expirations
The current week’s SPX skew, narrowed to near-dated contracts where the shape is steepest and moves fastest.
SPX
Gamma exposure and key levels
Signed gamma by strike, call and put walls, and the levels traders watch as support and resistance.
Read the guide →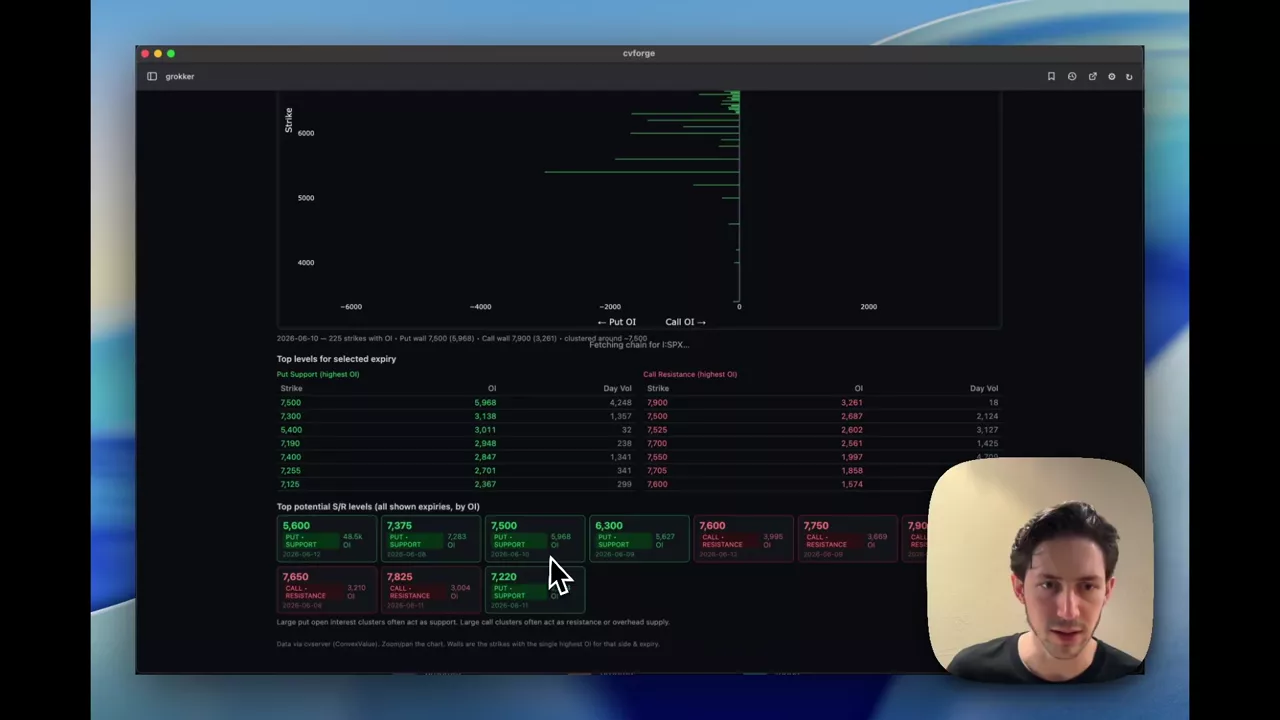 2:39
SPX call and put strikes that could act as support and resistance
Where SPX open interest and volume concentrate above and below spot, framed as the levels traders watch for support and resistance.
SPX
 1:26
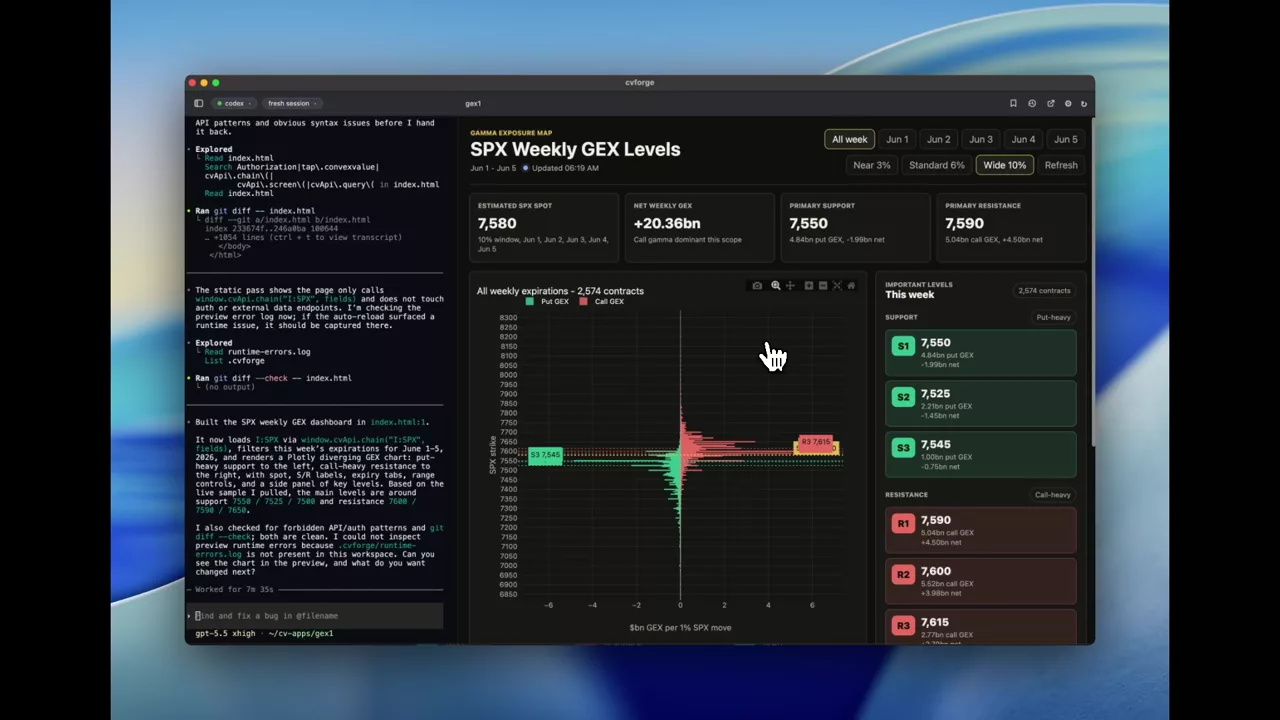
This week’s SPX gamma levels on one chart
SPX gamma exposure narrowed to the current week’s expirations, so the near-dated strikes driving this week’s hedging are not diluted by longer-dated open interest.
SPX
 1:04
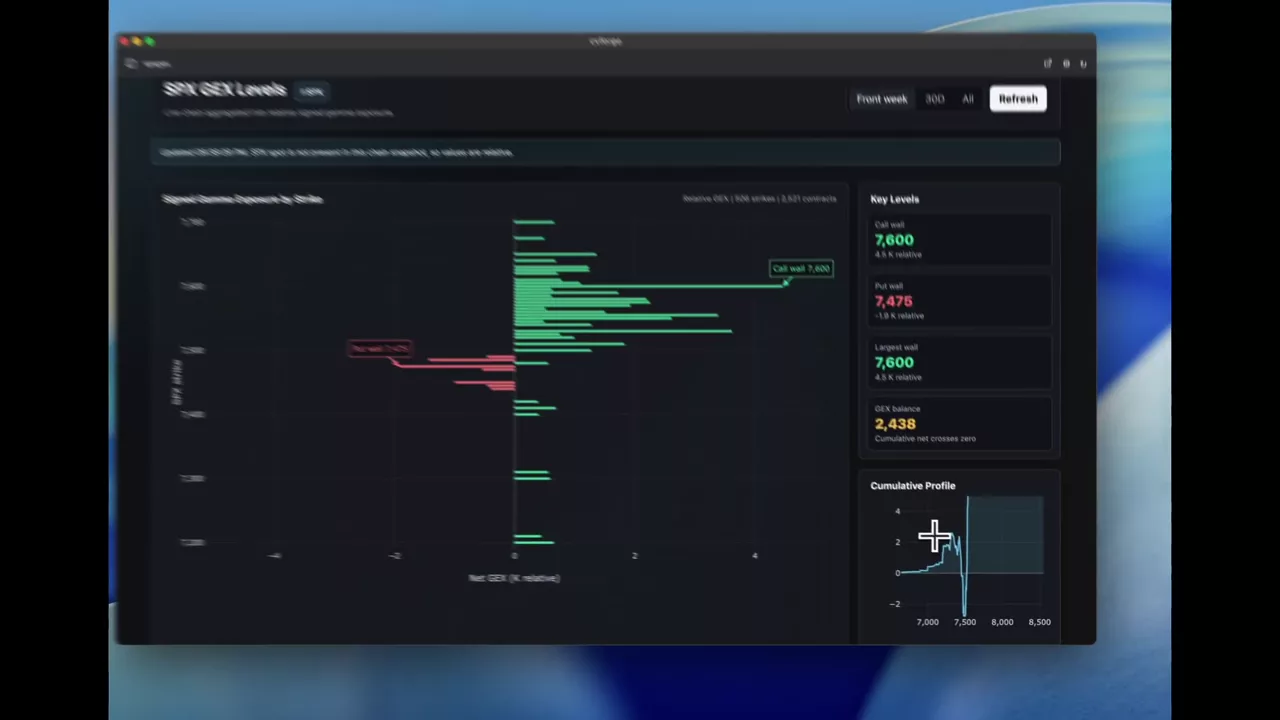
SPX gamma exposure levels, call wall and put wall
Signed gamma by strike for SPX with the call wall, put wall and largest wall marked, plus a cumulative profile and expiry-weight panel.
SPX
Payoff diagrams and P&L
What a structure pays across price and time, with theoretical premiums and break-evens estimated from Massive FMV.
Read the guide →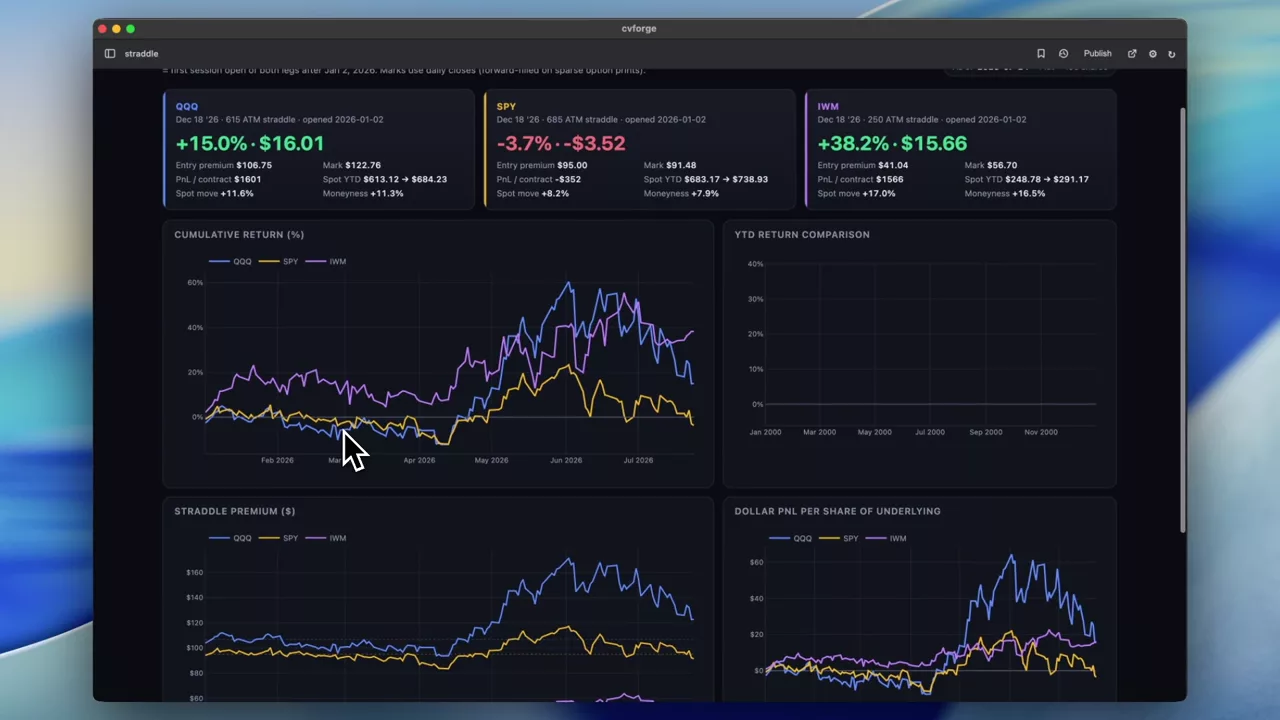 0:33
QQQ, SPY and IWM straddles compared year to date
The same trade in three index ETFs — a December ATM straddle opened in January — with the strike selection worked out from history for each one.
QQQ · SPY · IWM
 0:35
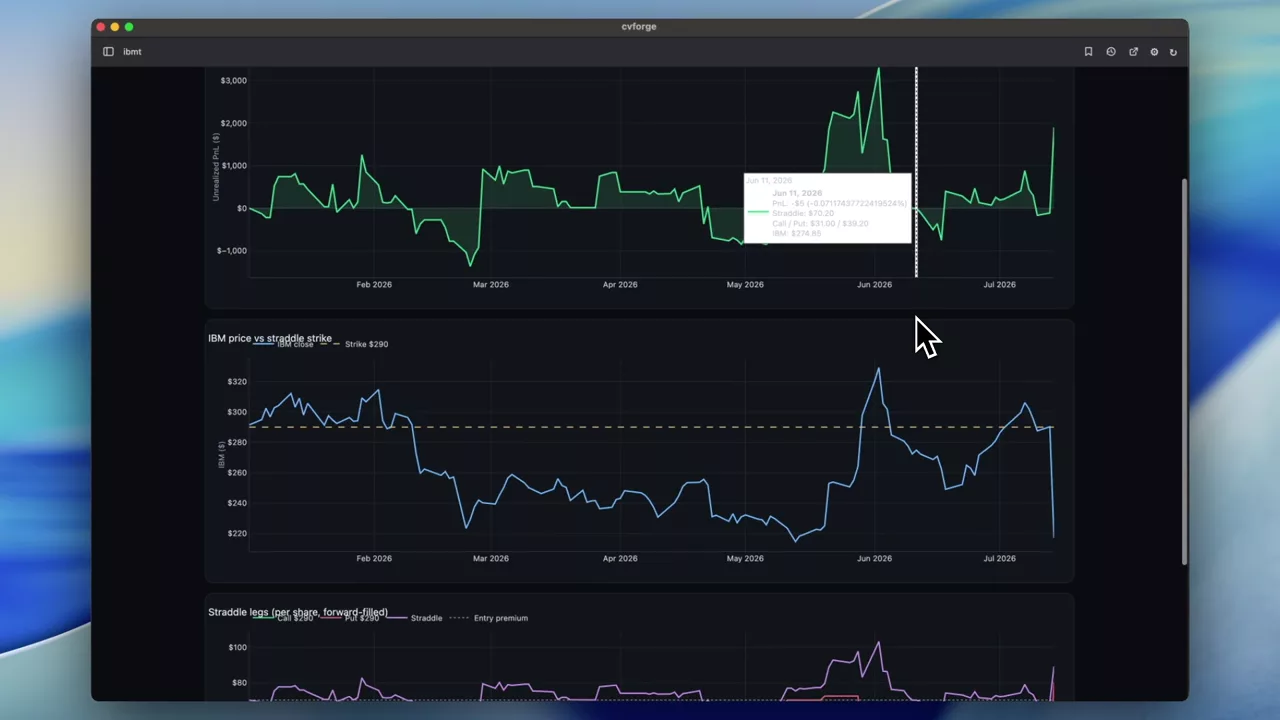
Holding an IBM December straddle from January
One trade, fully specified: buy the December 2026 ATM straddle on IBM on the first trading day of the year, then watch what the position did.
IBM
 0:56
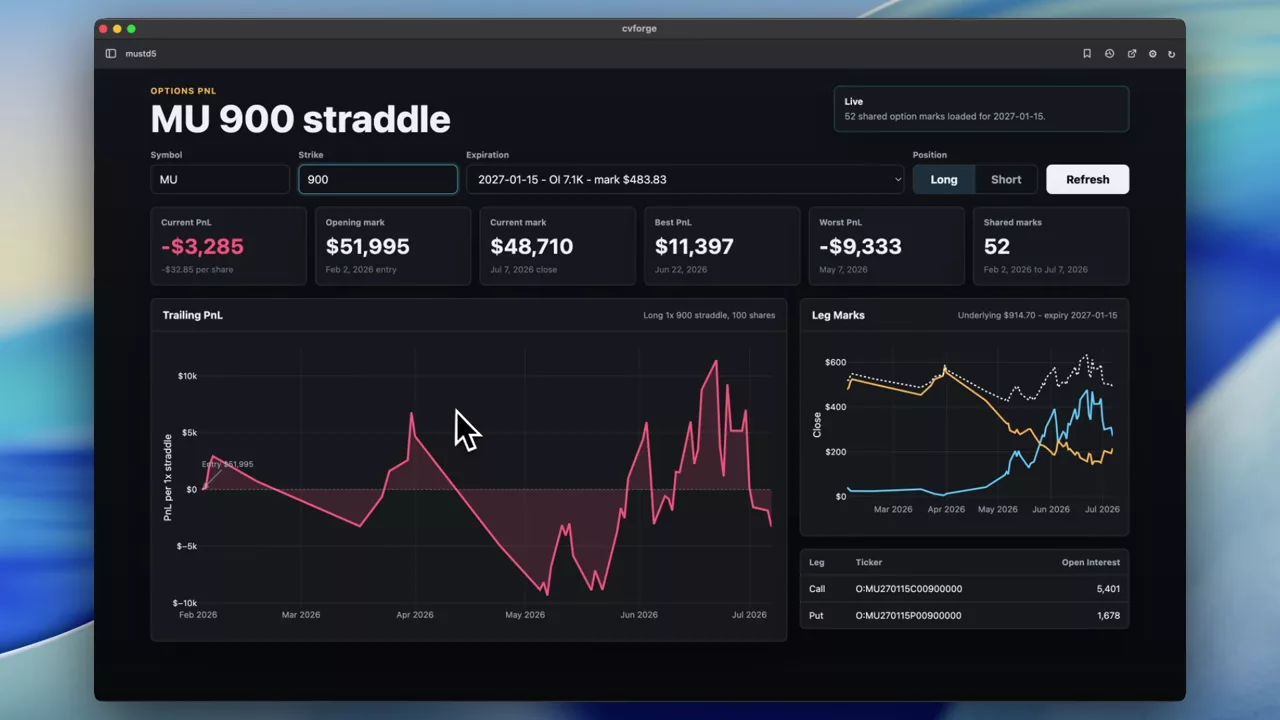
Six months of P&L on an MU 1000 straddle
How a single MU strike-1000 straddle performed over six months, tracked from end-of-day option history through a period of large moves in the name.
MU
 0:40
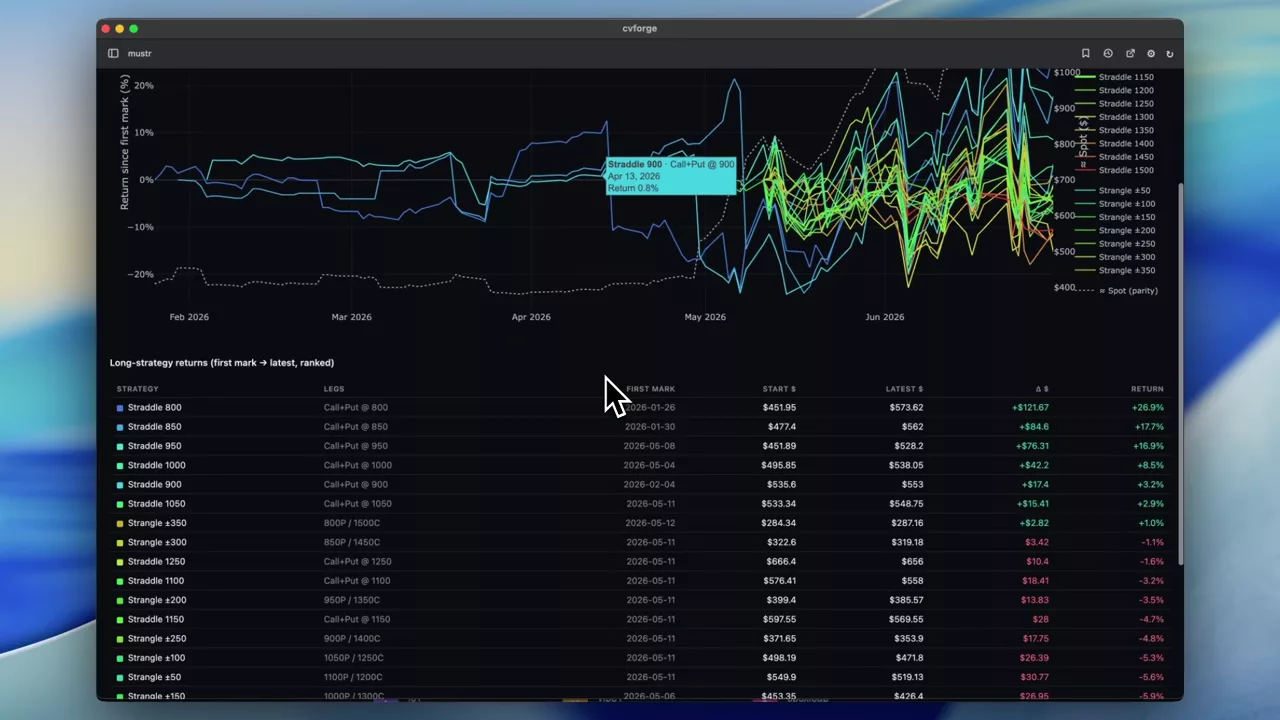
Every December MU strangle and straddle, year to date
Not one structure but all of them: the year-to-date performance of every December-expiration strangle and straddle on MU, so the whole strike surface is comparable.
MU
 1:03
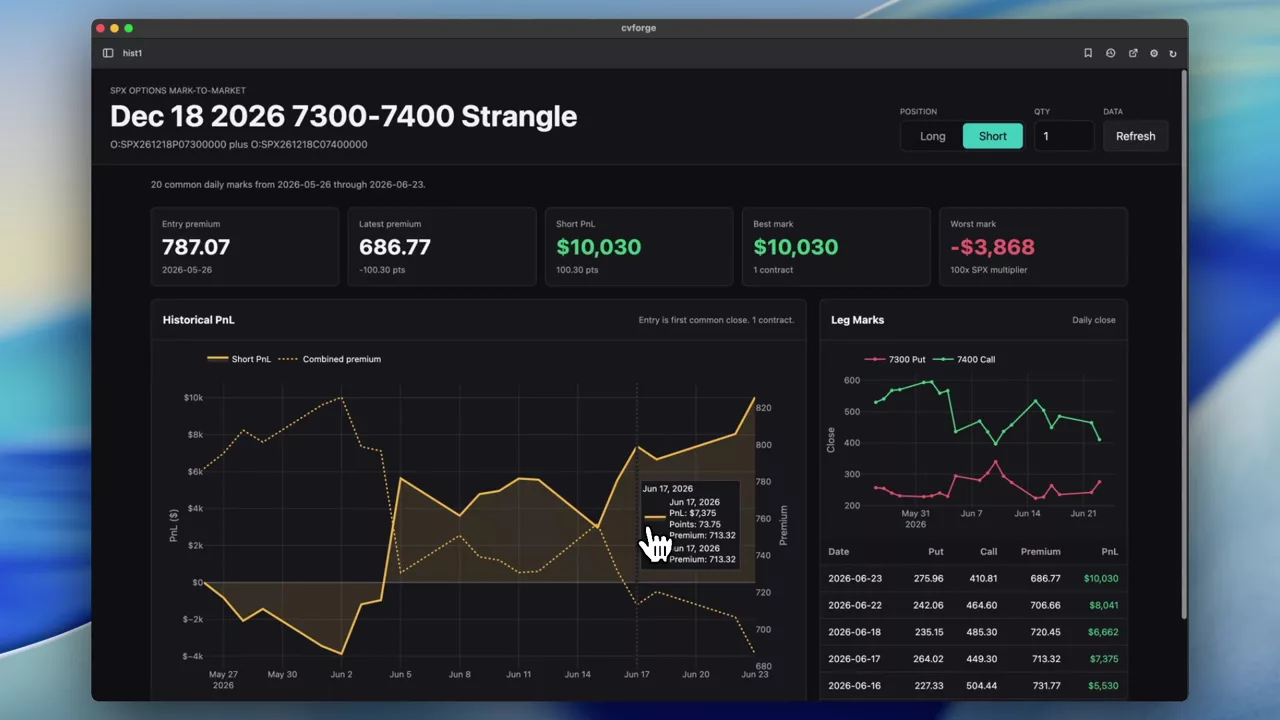
A month of P&L on an SPX 7300–7400 strangle
The realised profit and loss of one specific SPX December strangle over the past month, priced from daily option history rather than a model.
SPX
 1:36
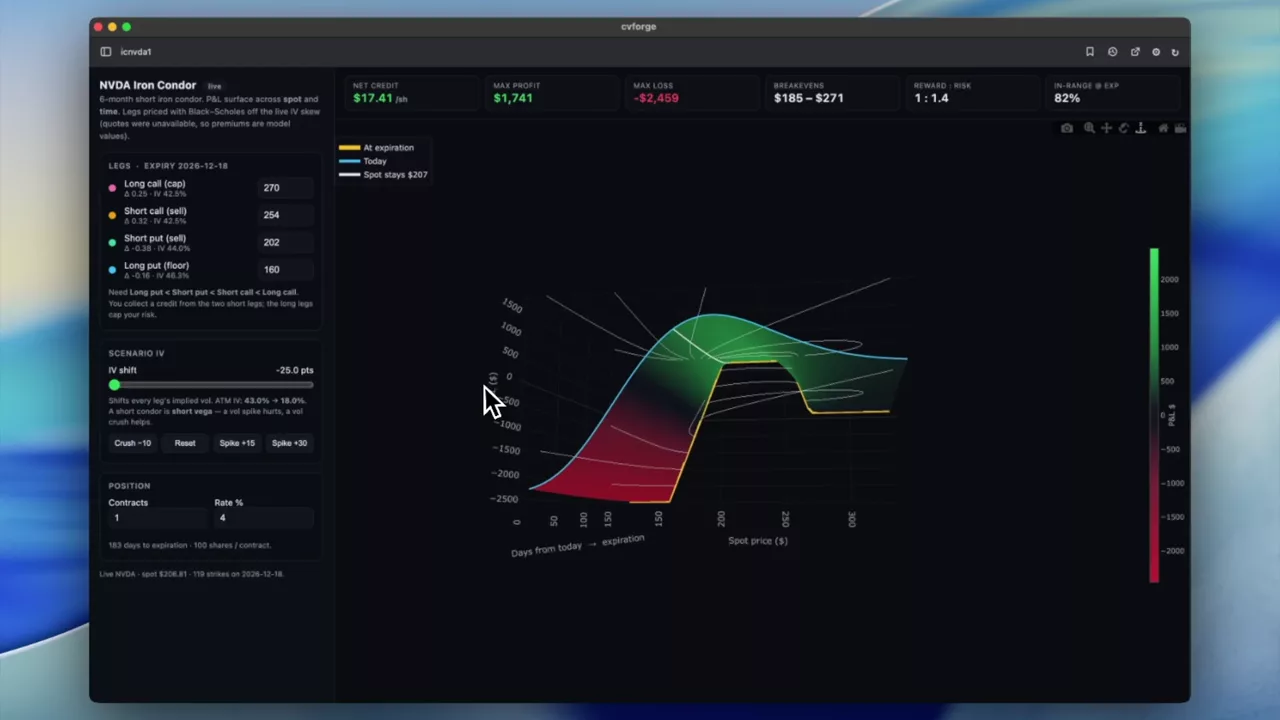
A 3D P&L surface for a six-month NVDA iron condor
P&L across both time and spot for a short NVDA iron condor, as a 3D surface with an implied-volatility control to run the scenario that actually matters.
 1:11
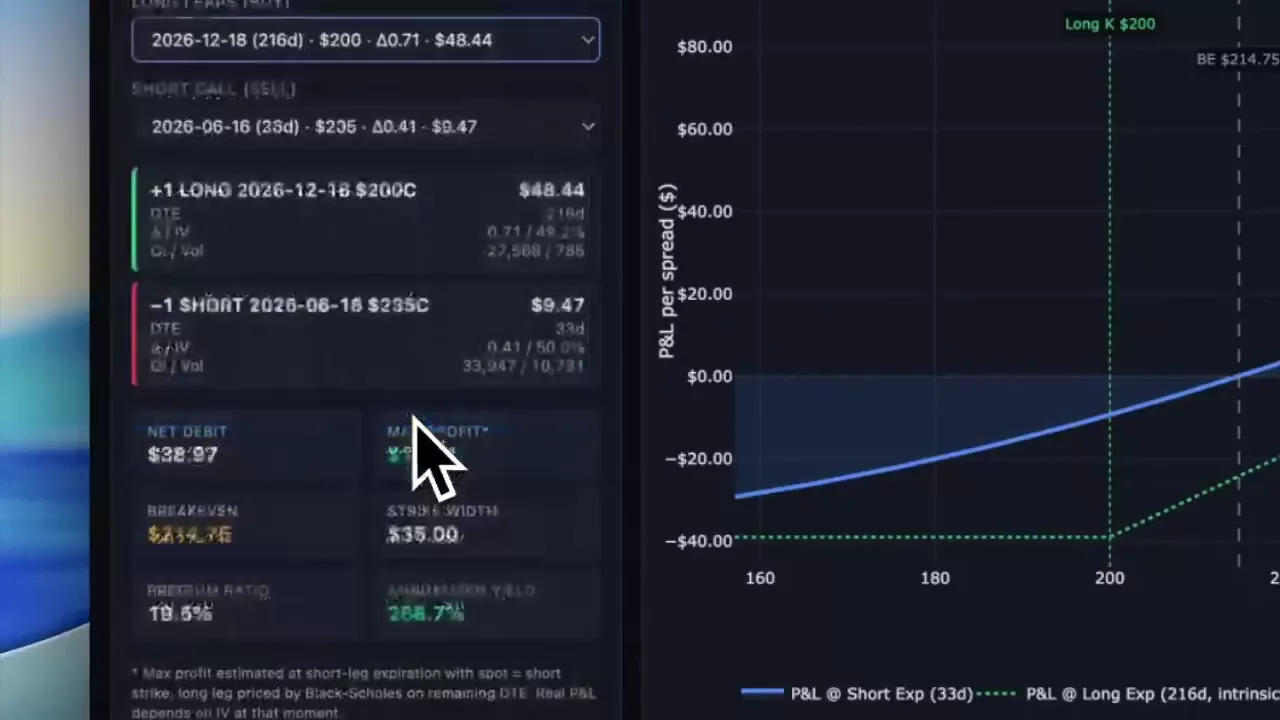
Finding a poor man’s covered call on NVDA
Candidate long-dated call and short call combinations on NVDA ranked as a diagonal spread, with payoff diagrams to compare the shapes.
NVDA
Structuring and ranking trades
Starting from a view and asking which structure expresses it: condors, strangles, spreads, ranked by risk and reward.
Read the guide →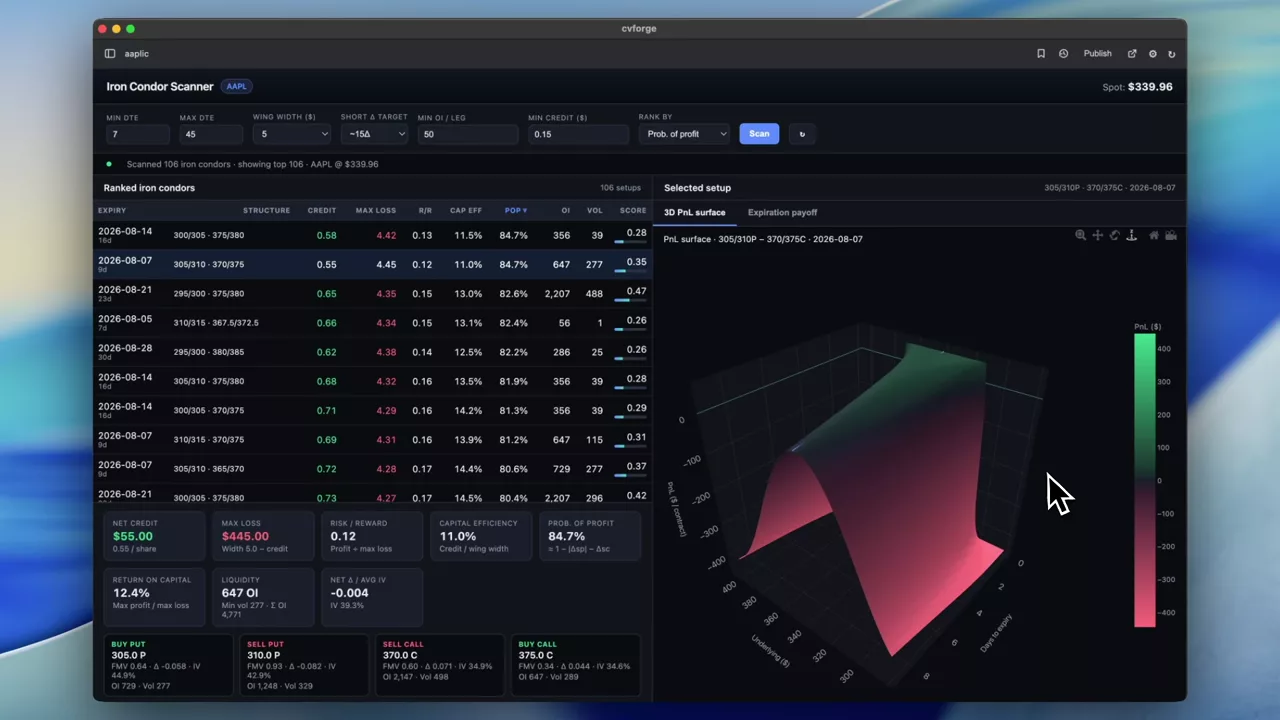 1:02
An AAPL iron condor scanner with a 3D P&L surface
Every condor on a single name ranked four ways at once — risk-reward, capital efficiency, probability of profit and liquidity — then the structure's P&L drawn across spot and time.
AAPL
 1:02
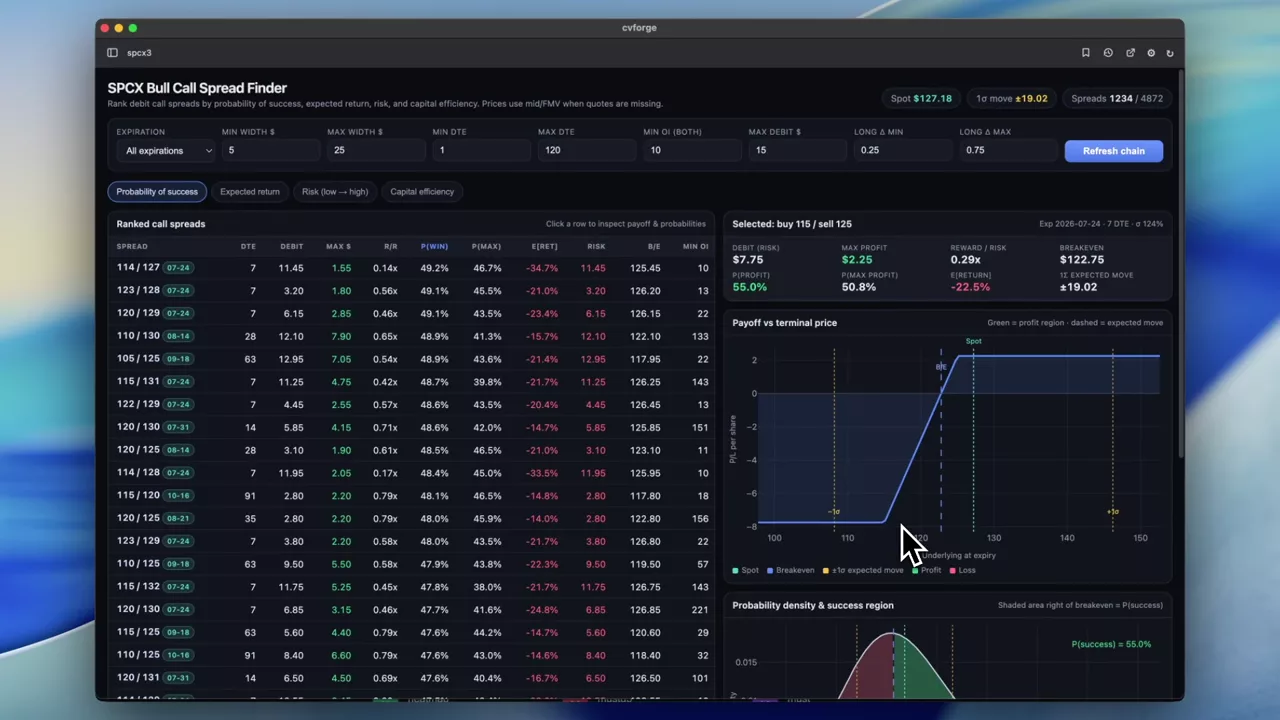
Ranking SPCX call spreads four different ways
Every call spread on SPCX ranked by probability of success, expected return, risk and capital efficiency, with the expected move shown alongside.
SPCX
 1:12
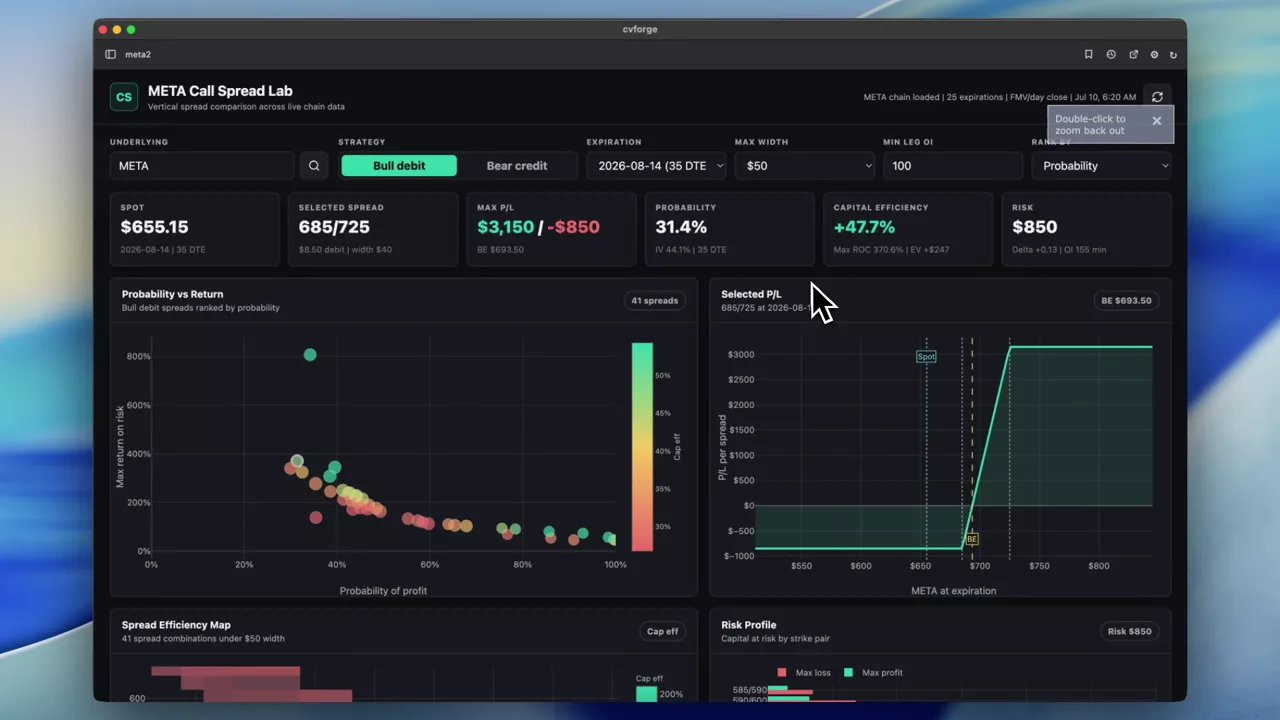
META call spreads compared on P&L, probability and efficiency
A comparison dashboard for call spreads on META covering P&L profile, probability of profit, risk and capital efficiency in one place.
META
 0:24
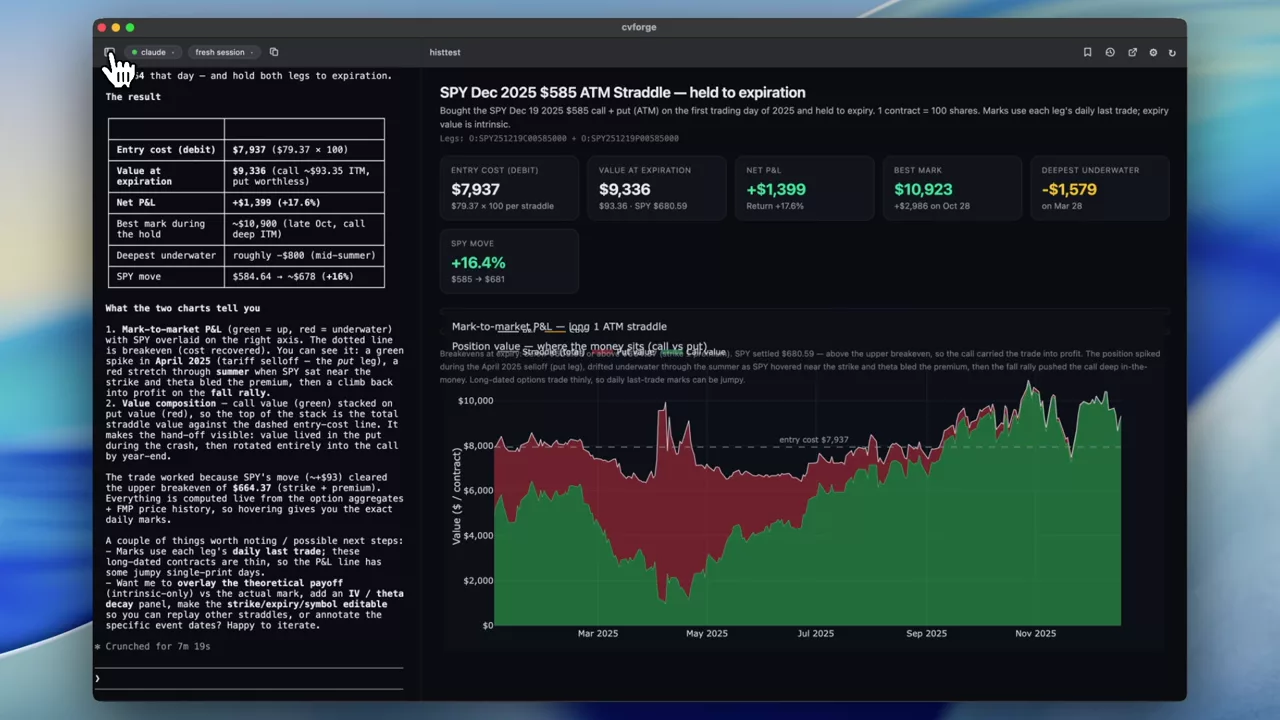
A SPY straddle held for all of 2025
One trade specified to the day: buy the December 2025 ATM straddle on the first session of the year, hold to expiration, and see what it did.
SPY
 1:13
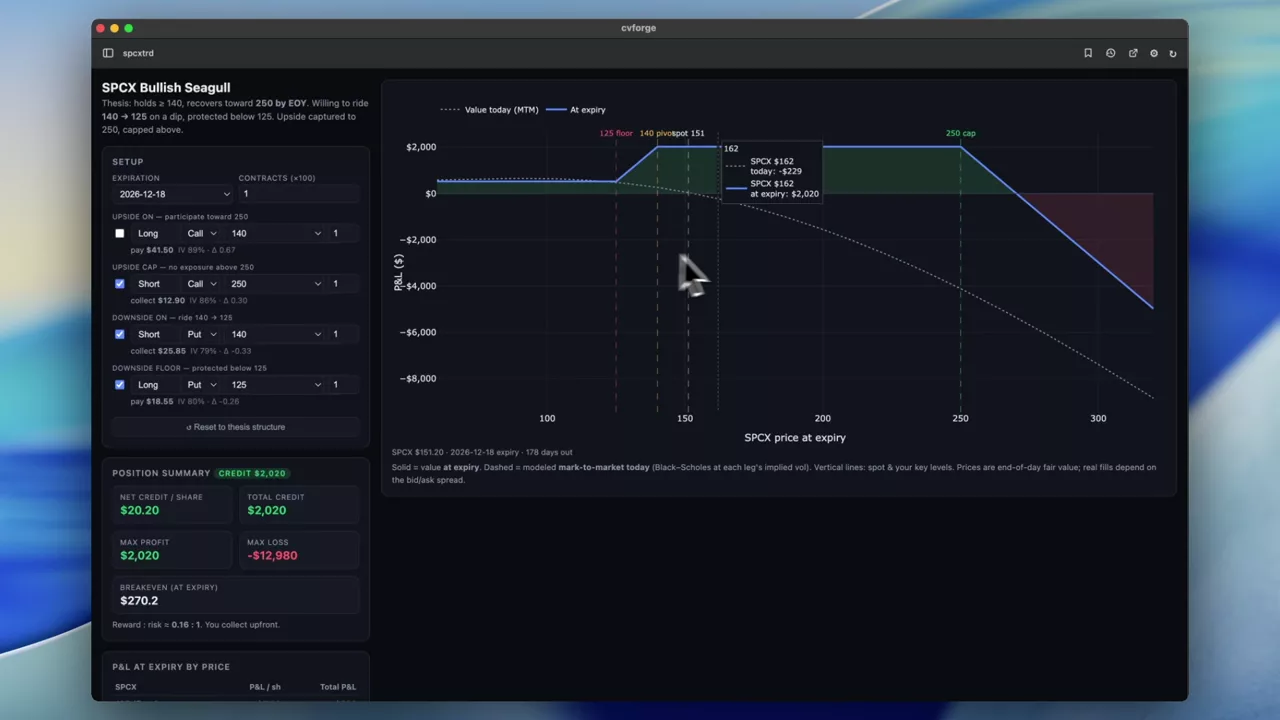
A bounded SPCX view turned into a bounded structure
Four constraints in one prompt — a floor, a target, a tolerable downside and a capped upside — and the structure that matches all of them.
SPCX
 0:51
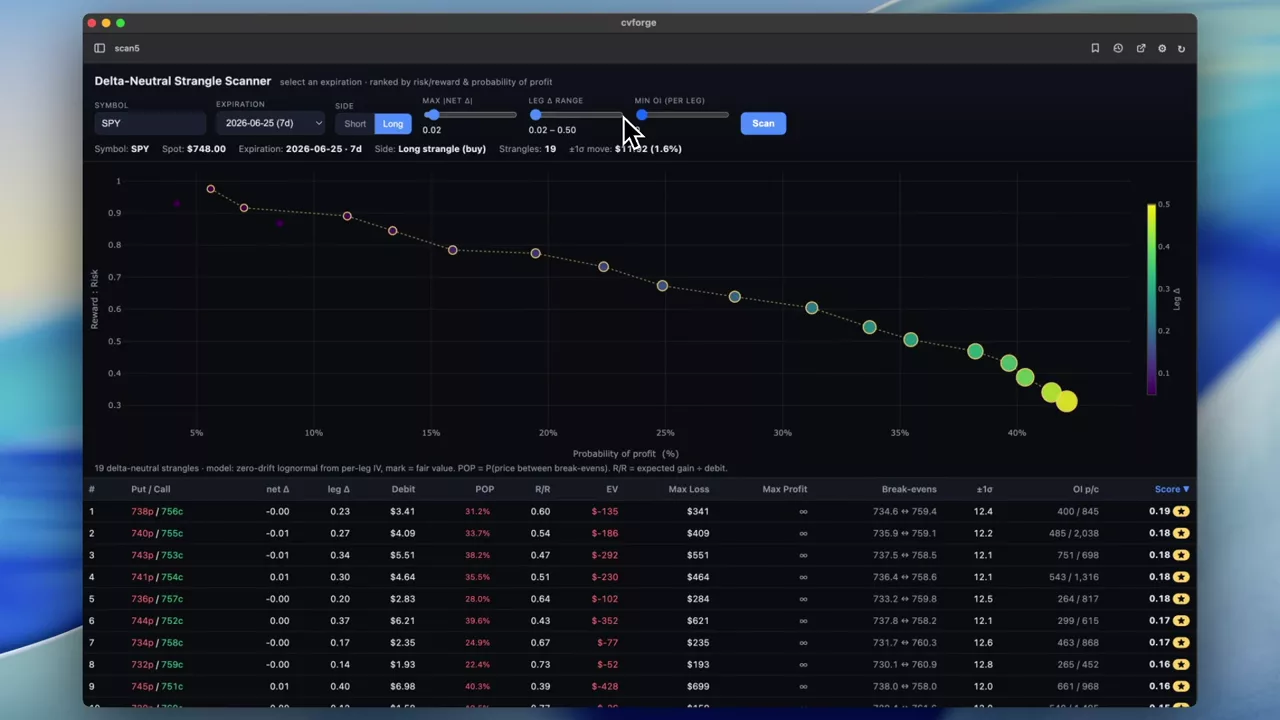
Delta-neutral strangles for one expiration, ranked
Pick an expiration and see every delta-neutral strangle available on it, ranked by risk-reward and probability of profit.
 0:48
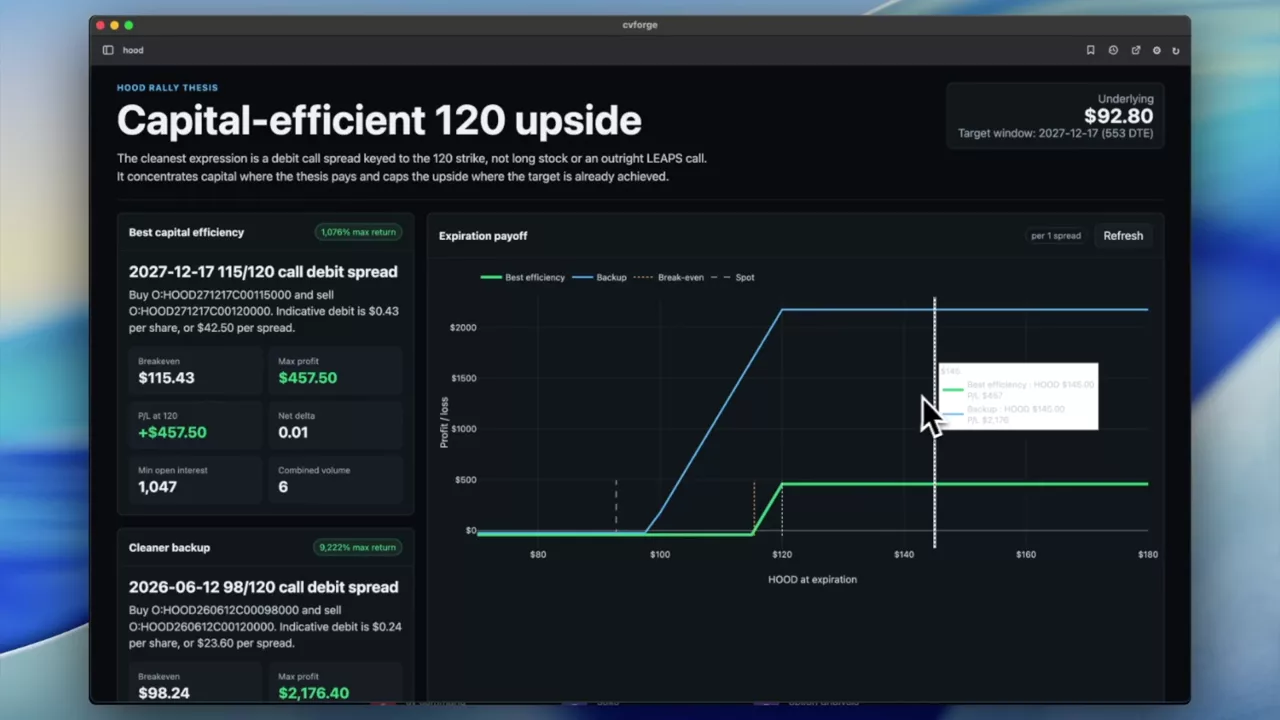
Expressing an 18-month HOOD view efficiently
A long-horizon view — HOOD above 120 within a year and a half — and the most capital-efficient way to hold it with options rather than stock.
HOOD
 0:50
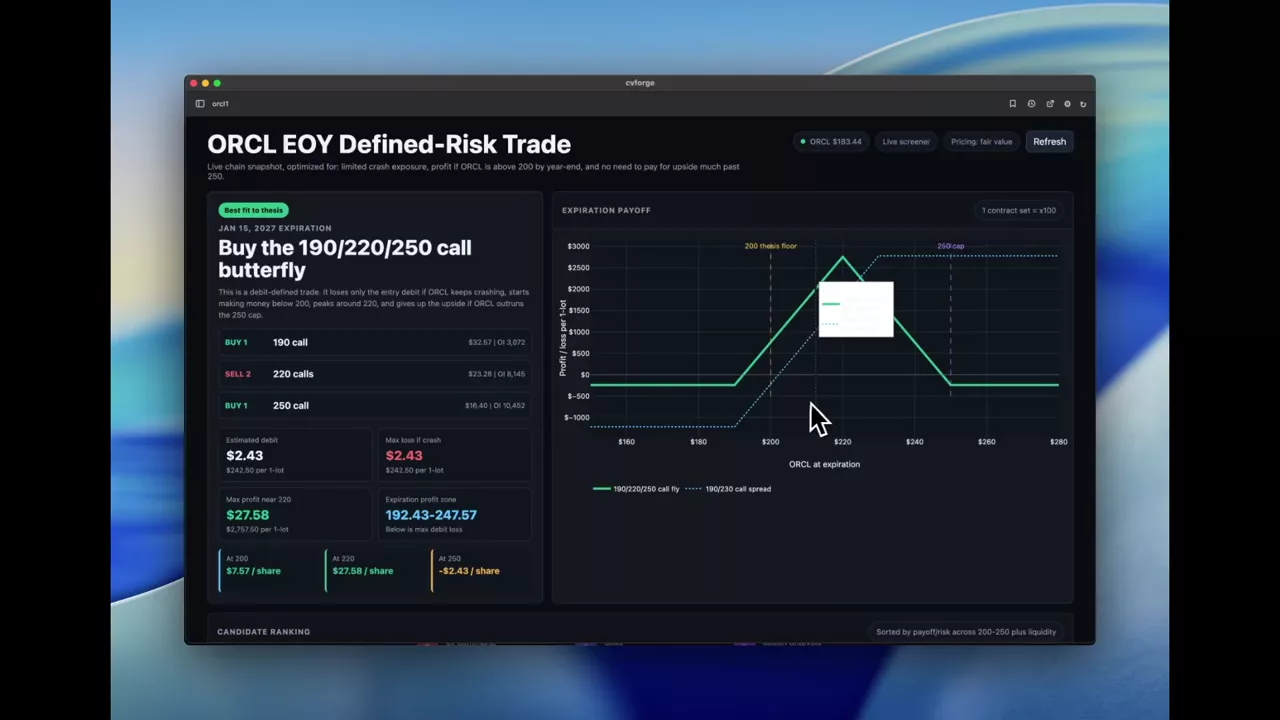
A three-sided ORCL view after a crash
No more downside, hovering above 200 by year end, and no expectation of 250 — three constraints that narrow to a small set of structures.
ORCL
 1:09
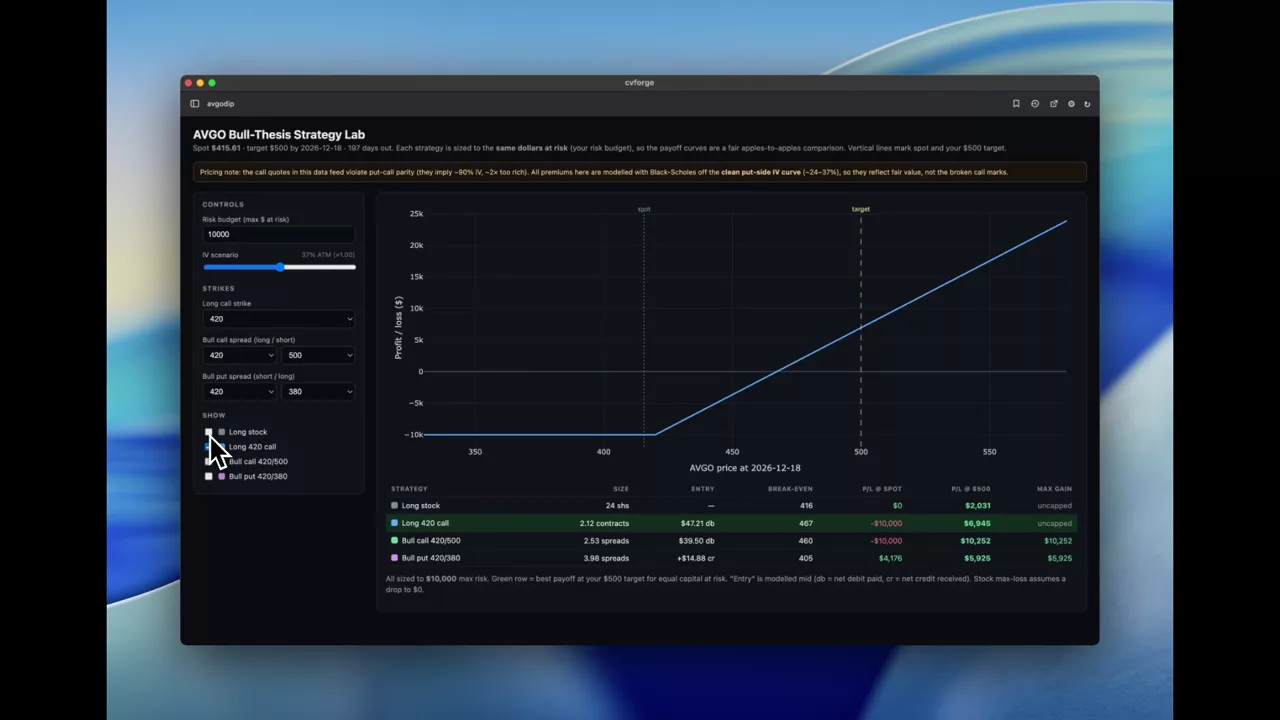
The most capital-efficient way to buy an AVGO dip
A view stated in plain English — AVGO fell below 420, I think it recovers to 500 by year end — turned into a comparison of long call, put spread and long stock.
AVGO
 2:51
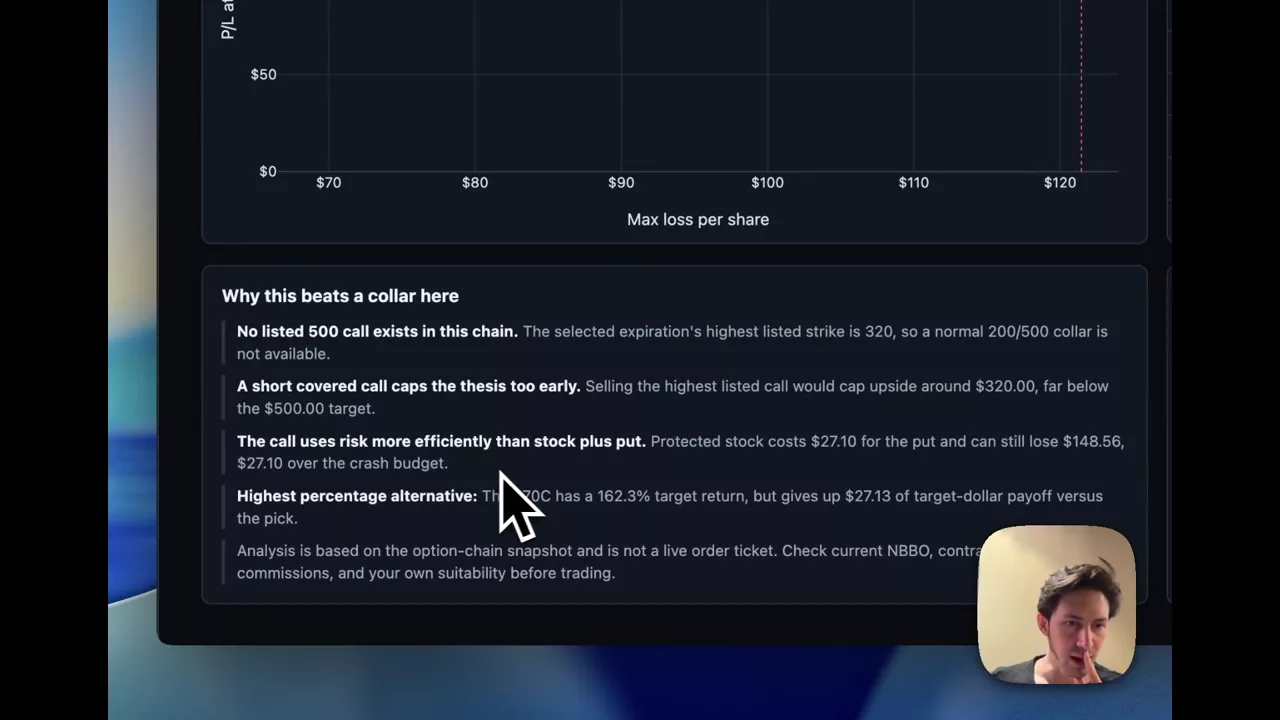
MRVL to 500, but not through 200: sizing a two-sided view
An upside target with an explicit crash tolerance, which turns the problem from picking a direction into bounding the loss.
MRVL
 2:00
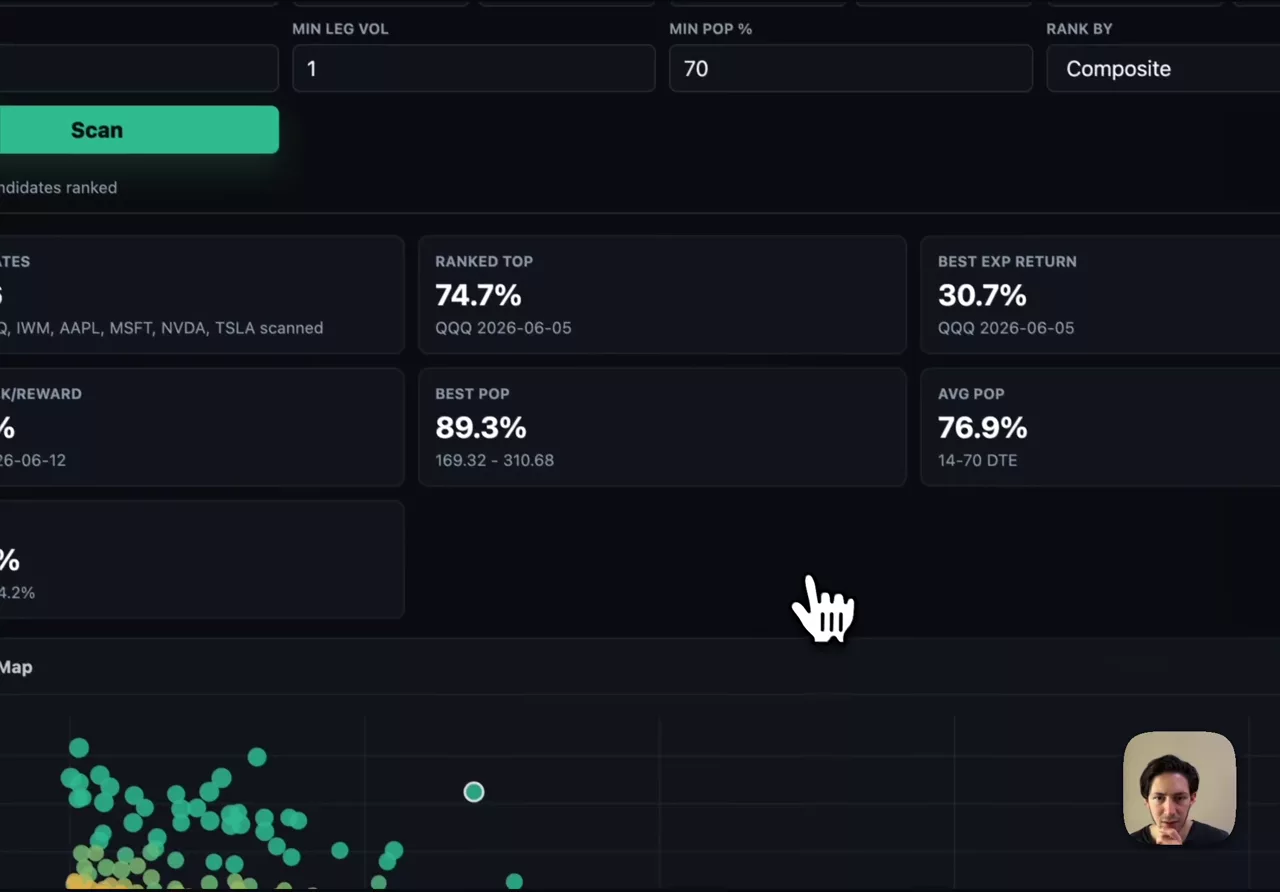
Scanning for the best iron condors across the market
Iron condors ranked by expected return, risk-reward and probability of profit, with open interest and volume filters to keep untradeable strikes out.
Earnings dashboards
What the chain prices into an earnings date, and how the print compared with expectations afterwards.
Read the guide →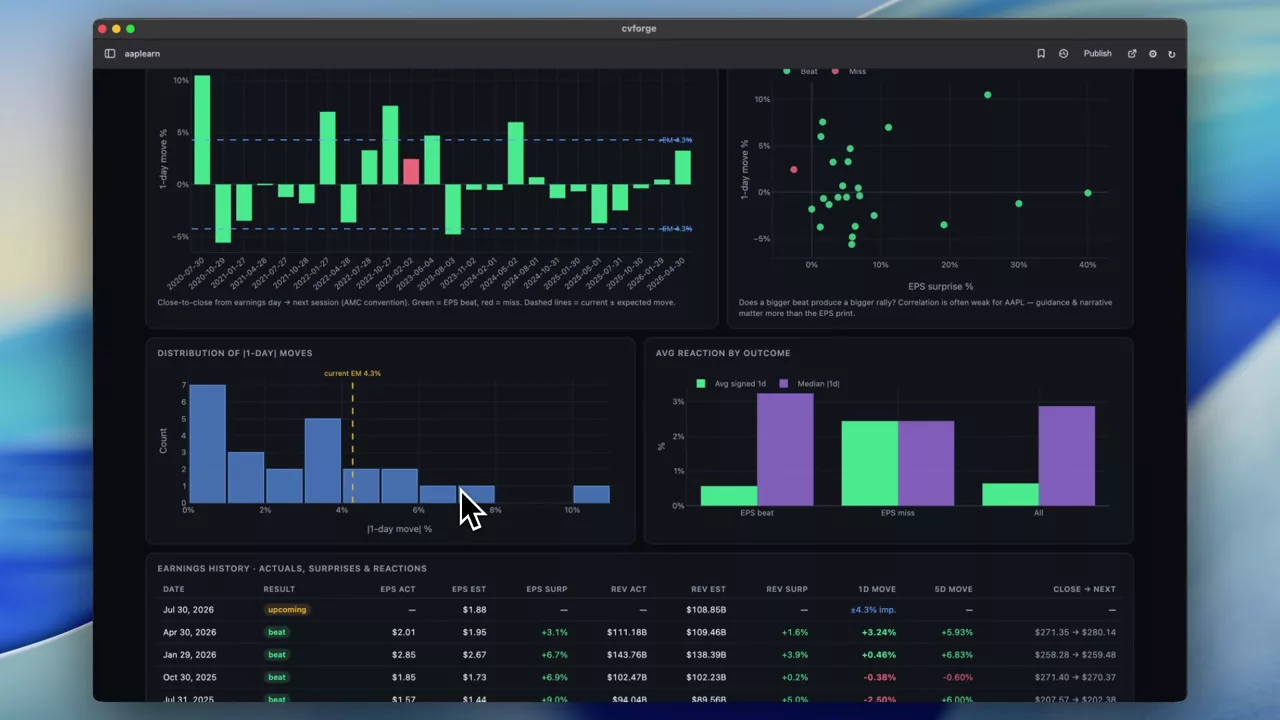 1:55
The AAPL earnings setup: implied move, estimates and past reactions
What the chain prices before an Apple print, where consensus sits, and how the stock actually moved after previous quarters — the three normally live in three different tools.
AAPL
 0:38
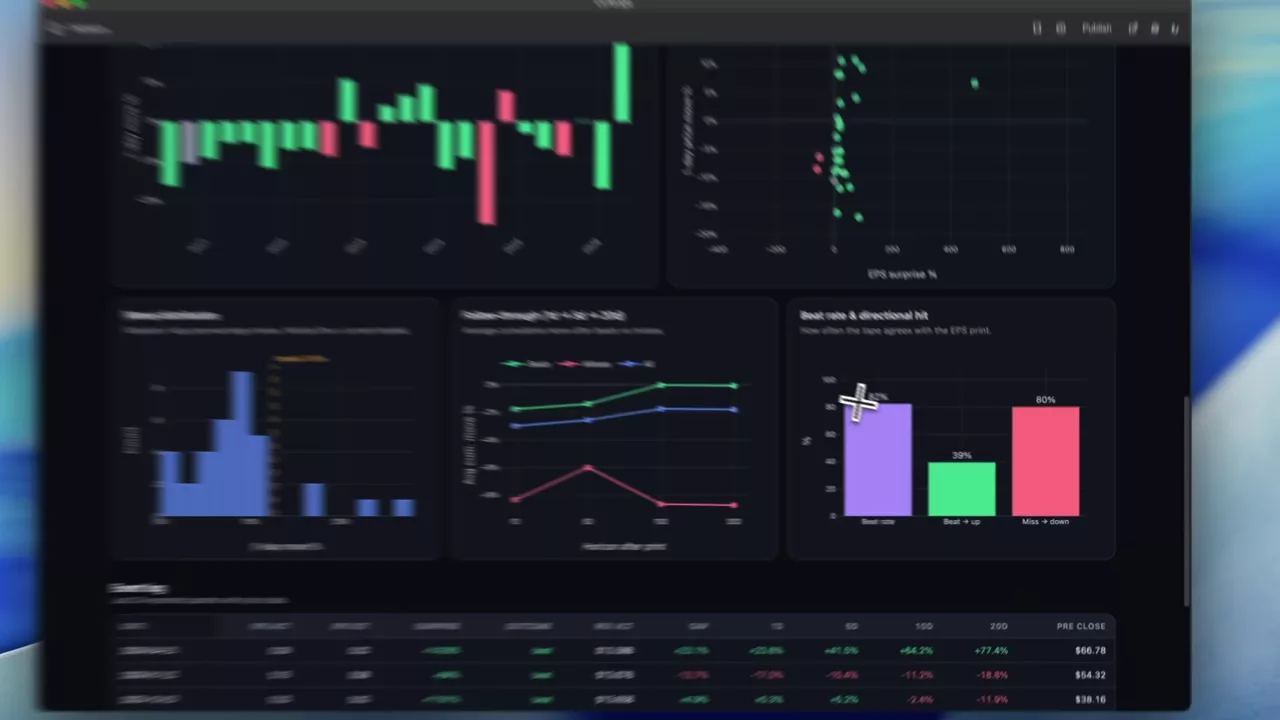
INTC implied move plus a history of beats and misses
Two views for one earnings date: what the chain prices in for Intel now, and how previous beats and misses translated into subsequent price moves.
INTC
 1:36
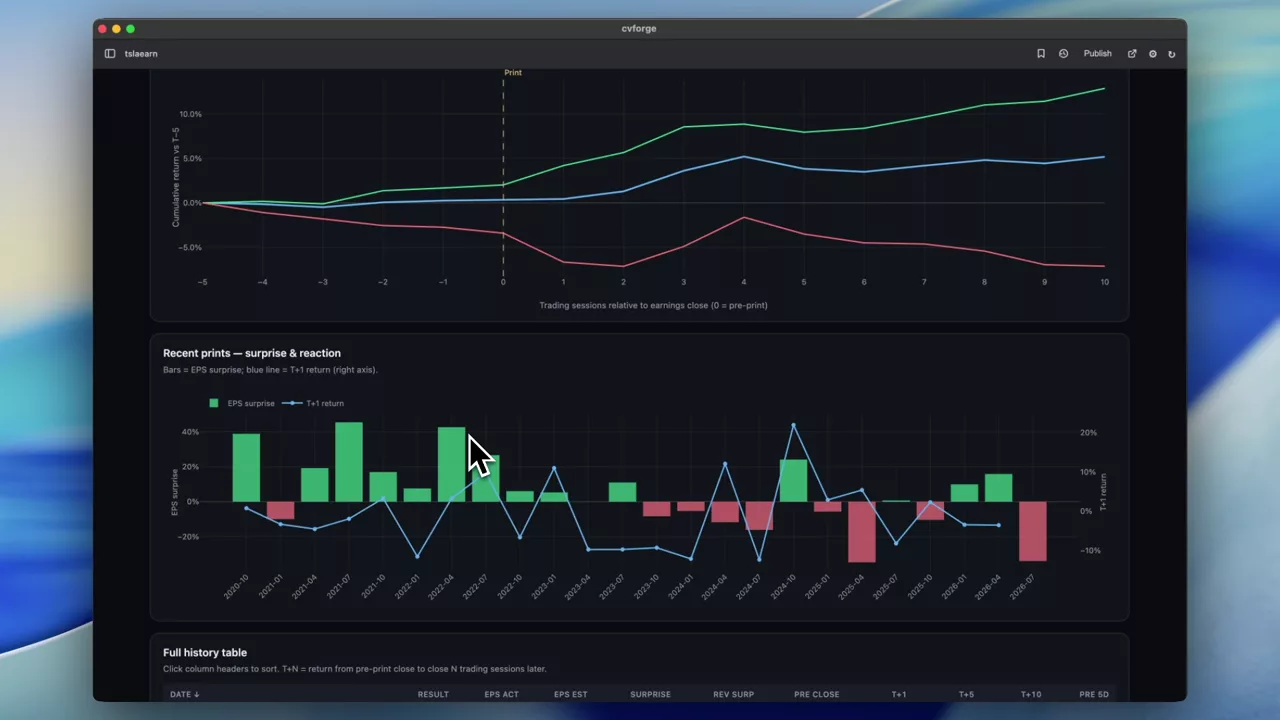
How TSLA has historically moved after earnings
Every recent TSLA print — actual against expected, and the price action that followed — arranged so the pattern of post-earnings moves is the thing you see first.
TSLA
 1:00
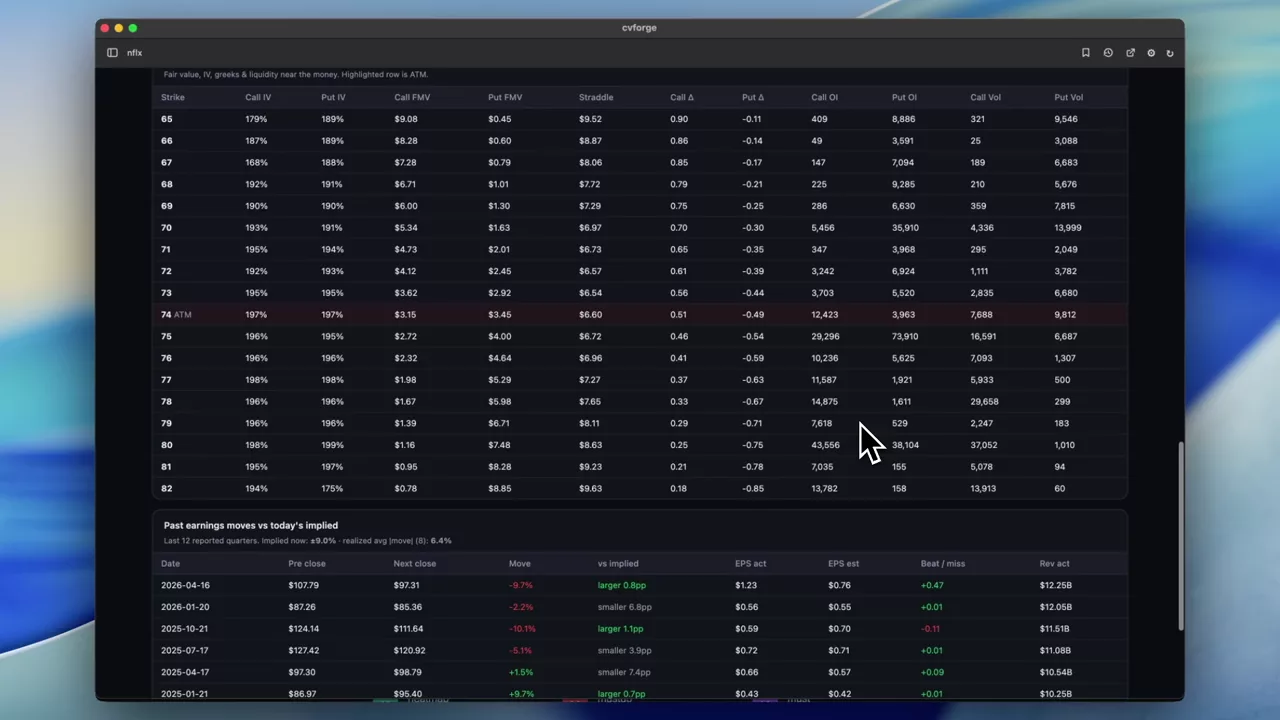
What NFLX options price in before earnings
The expected move, upside and downside ranges, and risk skew for Netflix ahead of a print — derived from current implied volatility and FMV estimates.
NFLX
 0:43
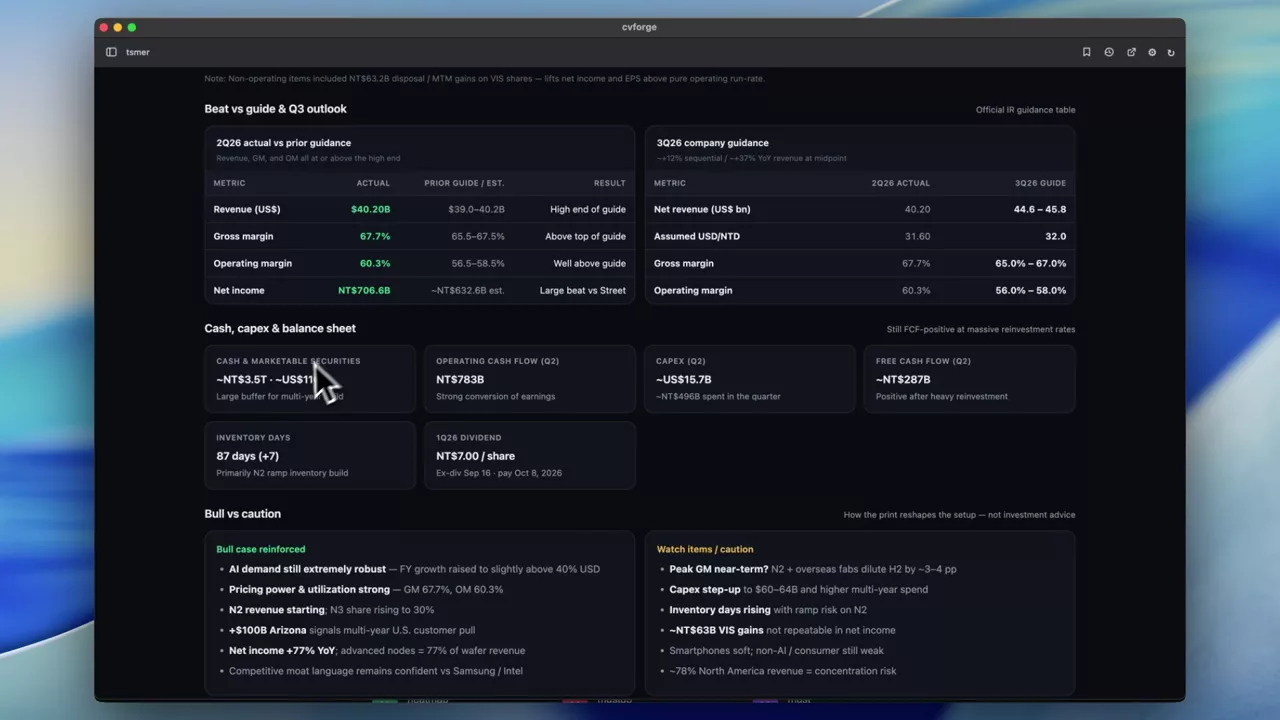
A full TSM quarterly earnings report from one prompt
A written-up report on TSMC’s Q2 2026 quarter — statements, comparisons and context — generated as a single document rather than a set of charts.
TSM
 0:30
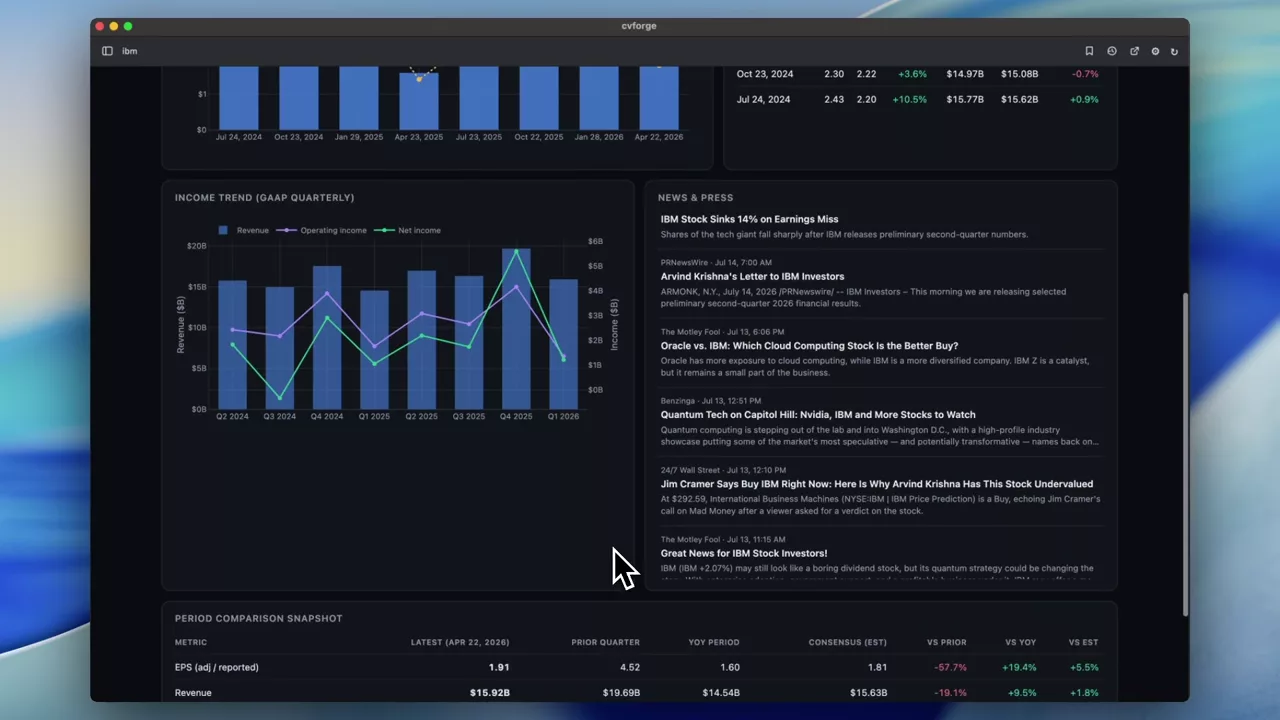
IBM earnings dashboard: results against expectations
IBM’s latest quarter next to prior periods and analyst expectations, with the news around it — assembled from one sentence in about half a minute.
IBM
 1:00
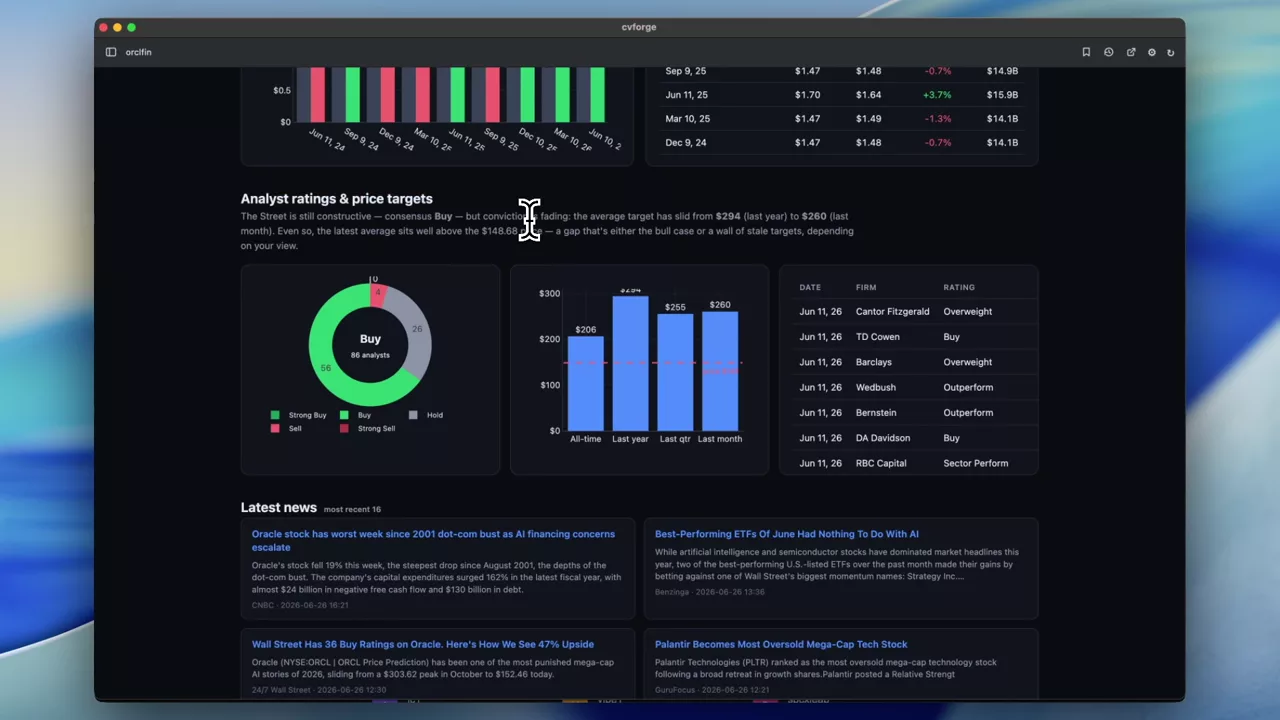
ORCL financial statements, earnings and analyst ratings
Oracle’s statements and latest earnings pulled together with analyst ratings, so the reported numbers and the sell-side view sit on the same page.
ORCL
Historical options analysis
Backward-looking studies on end-of-day options history — how a structure would have behaved, not how it ticks.
Read the guide →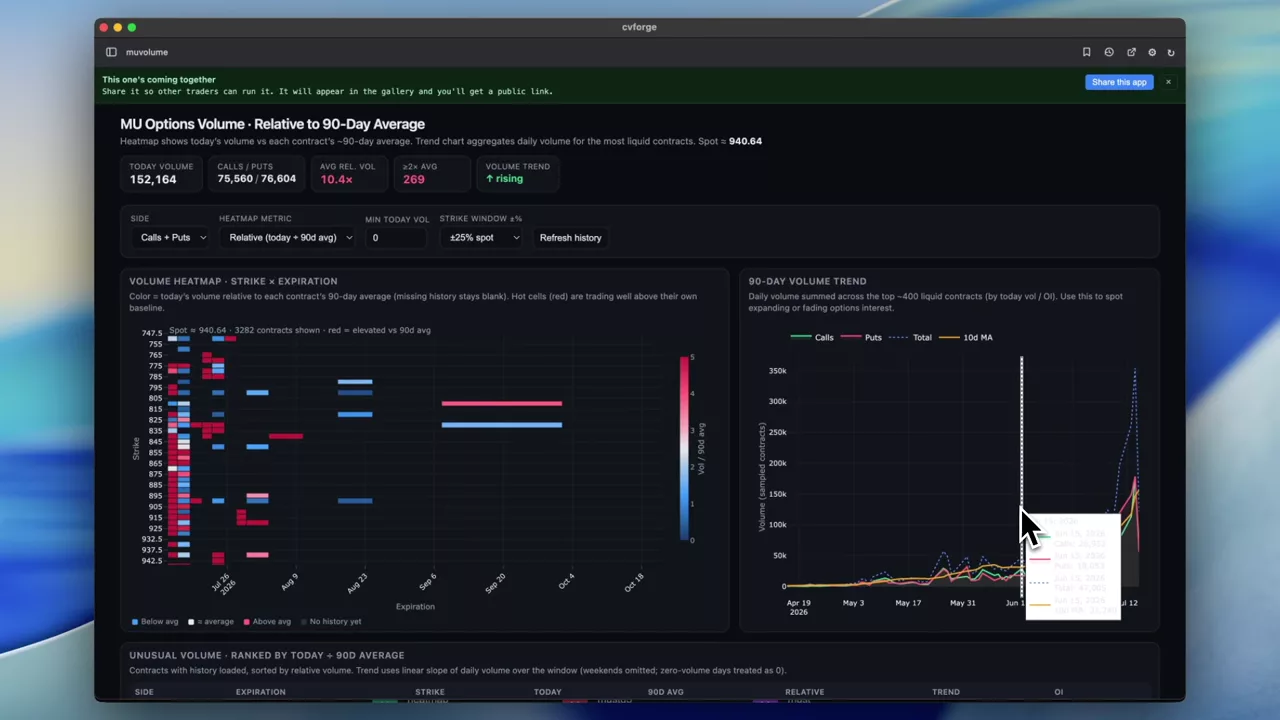 0:37
MU option volume against its 90-day average, as a heatmap
Ninety days of MU option volume rendered as a heatmap of current activity relative to its own historical average, so trends show up as bands rather than spikes.
MU
 0:55
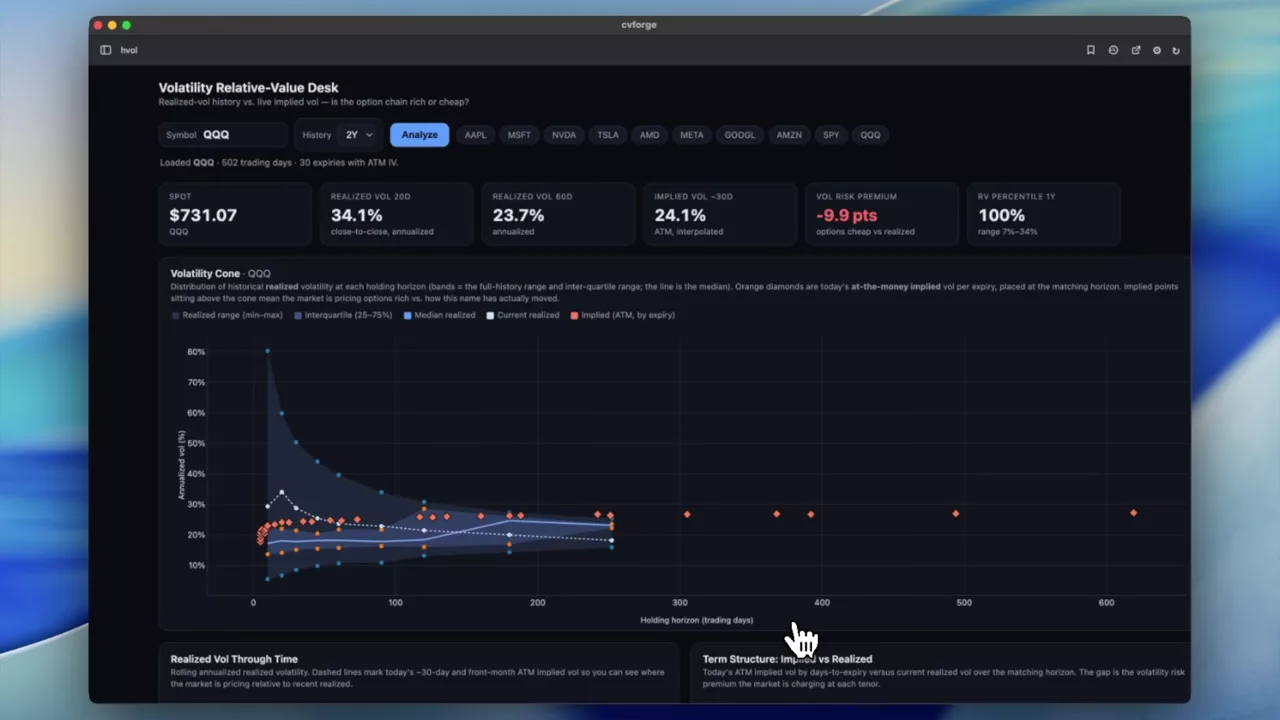
Judging whether options are expensive using volatility history
A dashboard for reading single-name volatility over time, so today’s implied level can be compared with where that name has traded rather than an absolute threshold.
 0:27
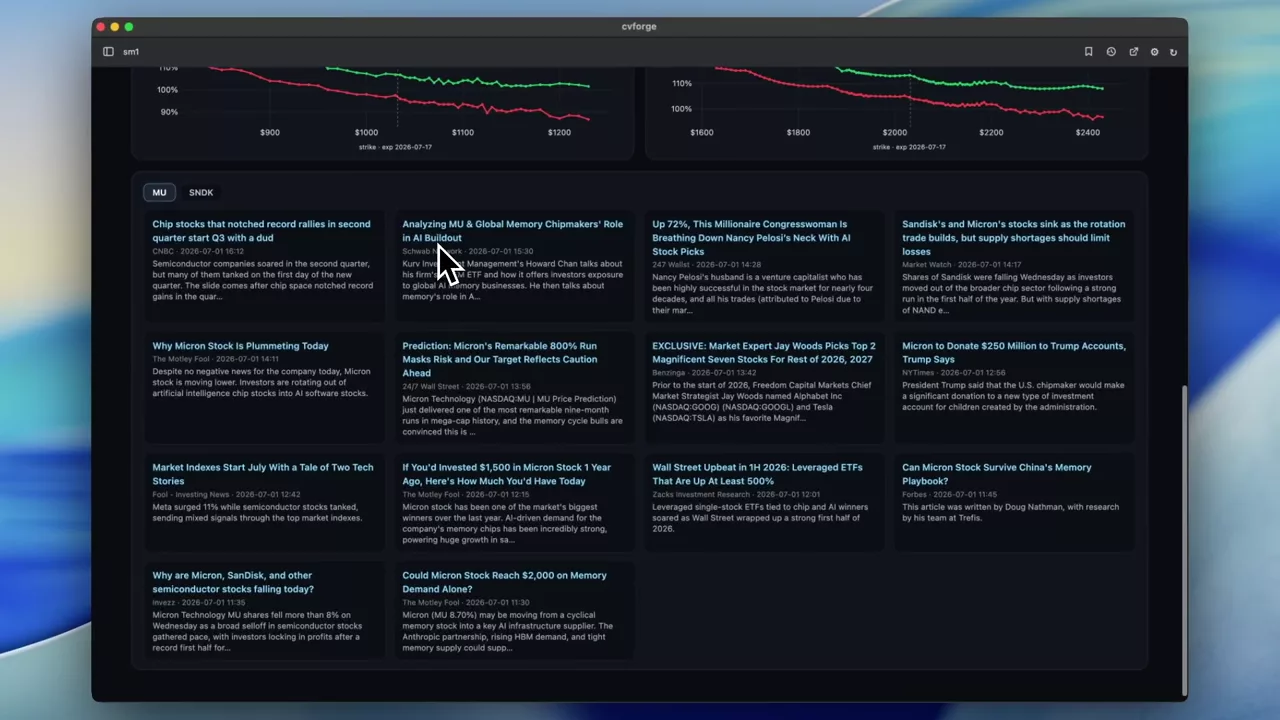
Today’s action on MU and SNDK against their own history
Options activity, price action in historical context and news for two related semiconductor names, built as one overview rather than two separate looks.
MU · SNDK
 0:28
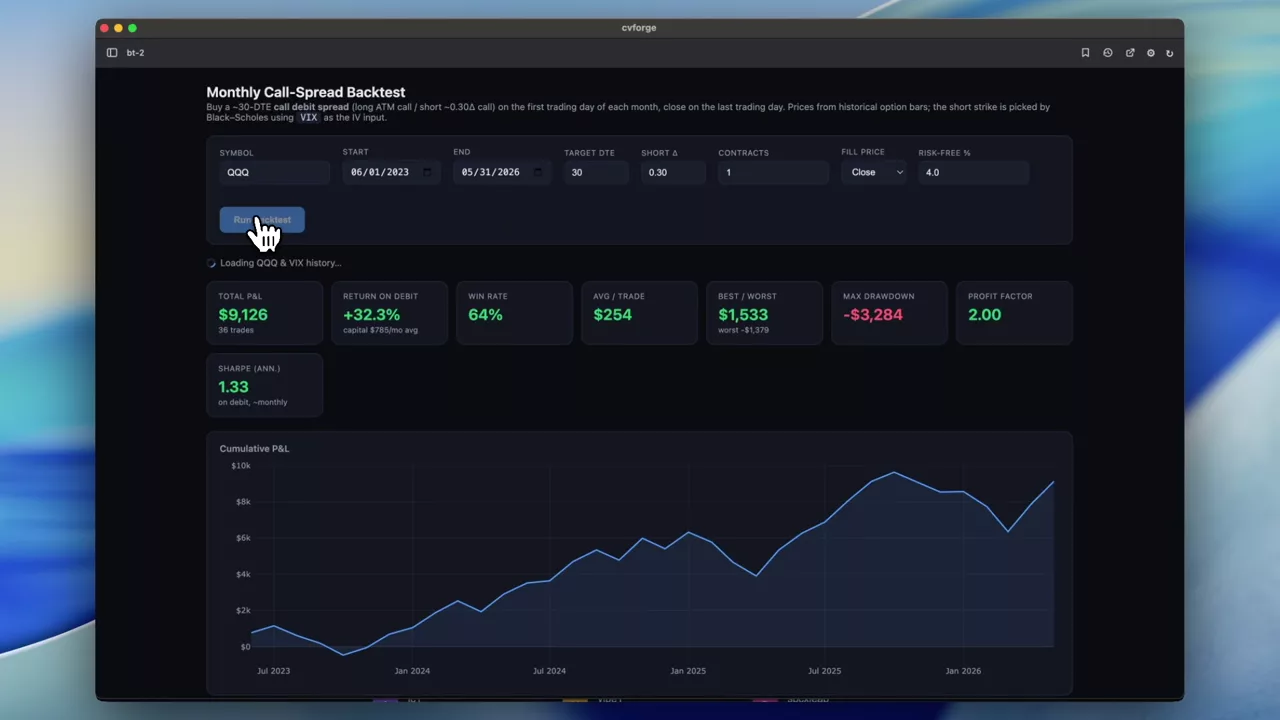
Backtesting a monthly 30-DTE SPY call spread
Buying an ATM call, selling the 0.30-delta call at 30 days out, once a month, closed at month end — run over history from end-of-day options data.
SPY
0DTE analysis
Same-day expirations: where the volume concentrates and what the day did to it.
 0:38
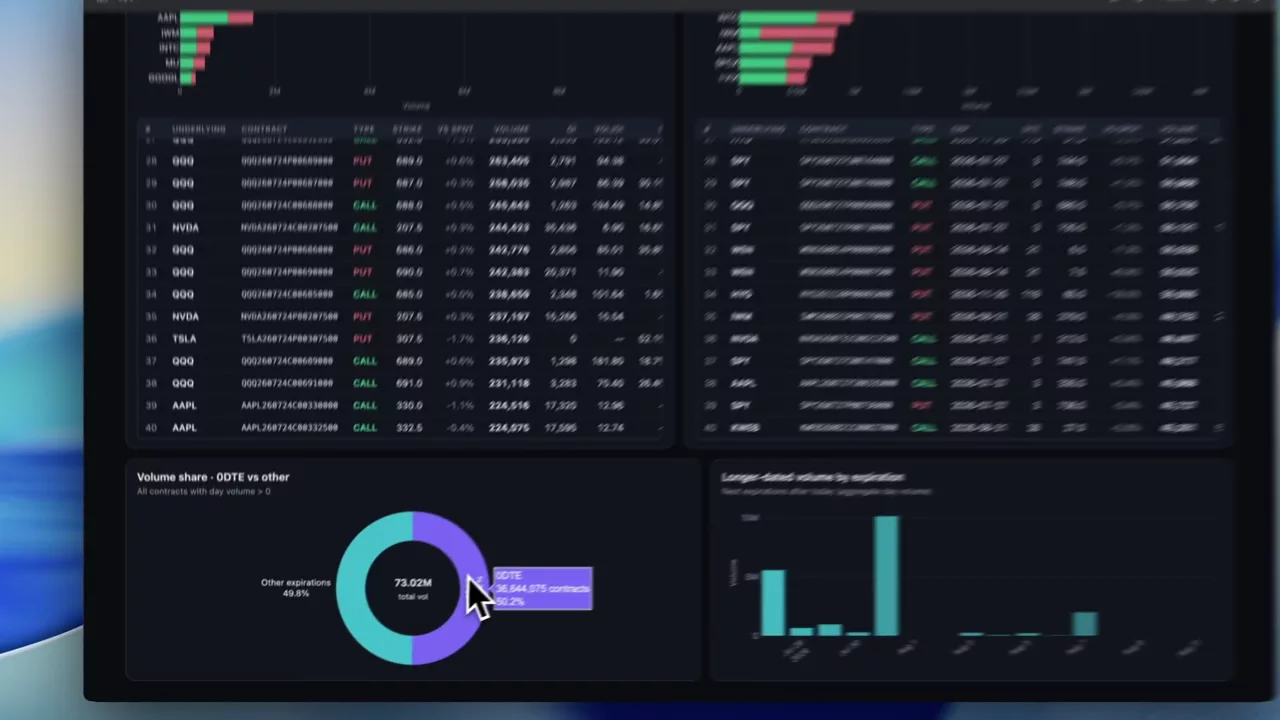
Separating 0DTE from the rest of the day’s option volume
The day’s most actively traded contracts, split into same-day expirations and everything else — because mixing the two makes a volume ranking almost meaningless.
 0:34
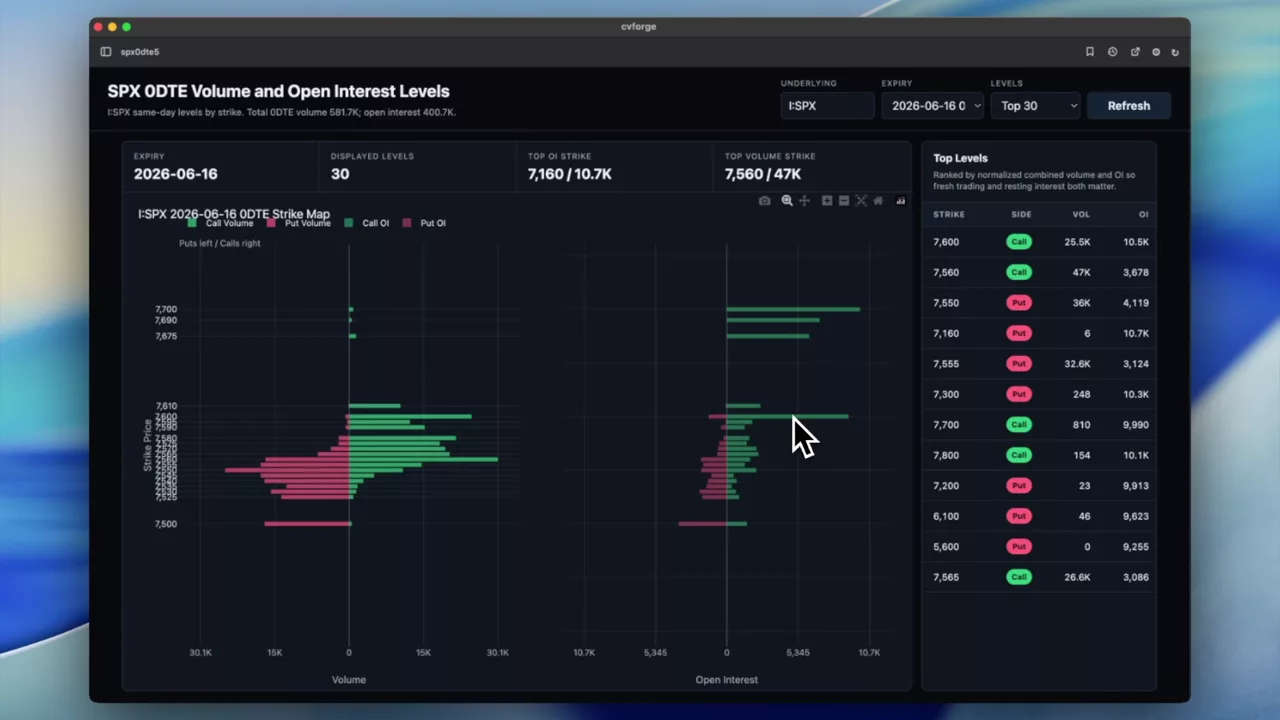
SPX 0DTE levels from volume and open interest by strike
Price on the vertical axis, volume and open interest running horizontally, so the strikes carrying today’s SPX same-day activity line up against spot.
SPX
 1:10
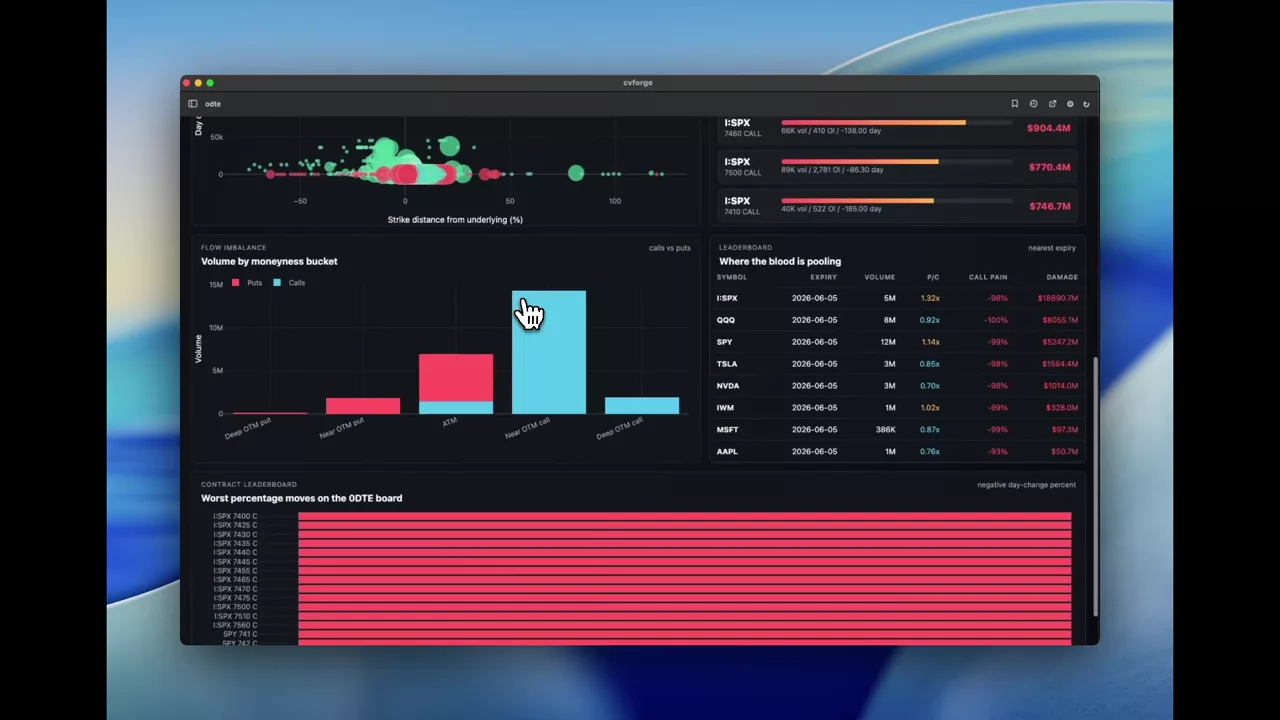
Scoring a bad day for 0DTE option buyers
A headline — "historic bloodbath in 0DTE land" — turned into a dashboard that scores it: premium destruction by strike, weighted call pain and the put/call volume split.
Correlation and relative value
Comparing names against each other and against their own history: correlation, realised versus implied, risk premium.
 0:35
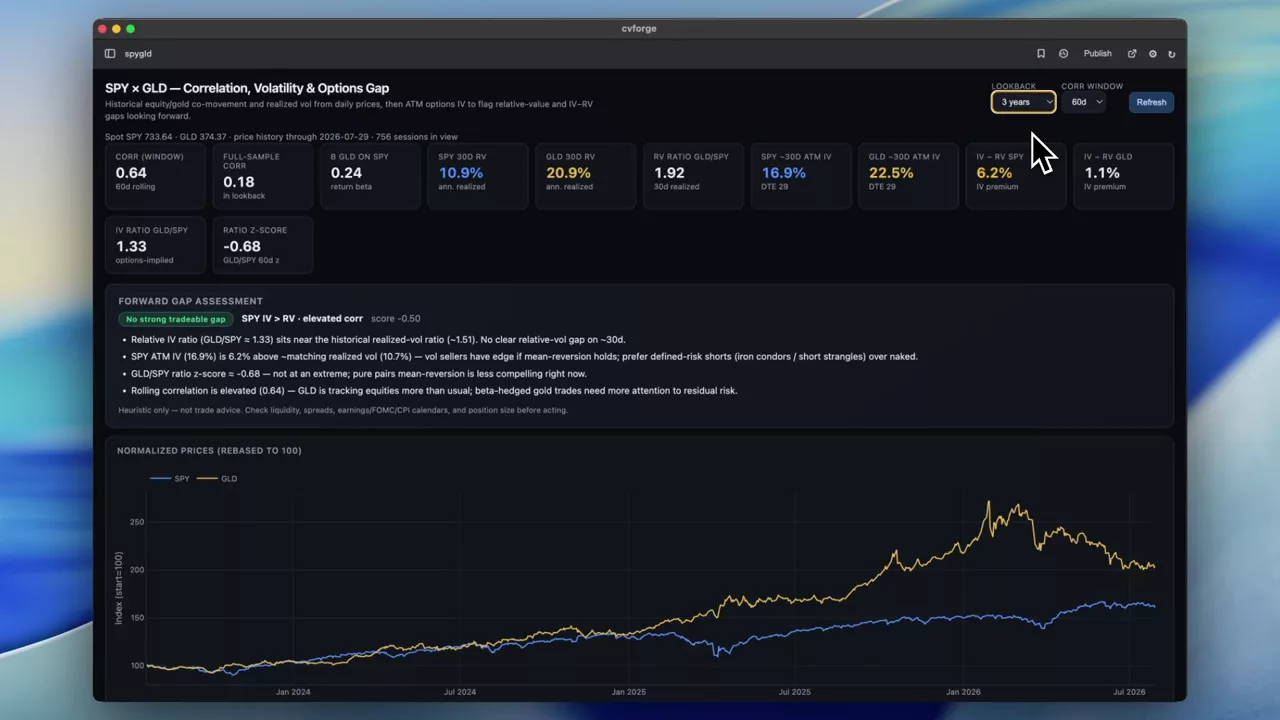
GLD against SPY: correlation, volatility, and whether there is a trade
Historical correlation and realised volatility for gold against the S&P, then current implied volatility and FMV estimates to test whether the difference is expressible as a position.
GLD · SPY
 0:43
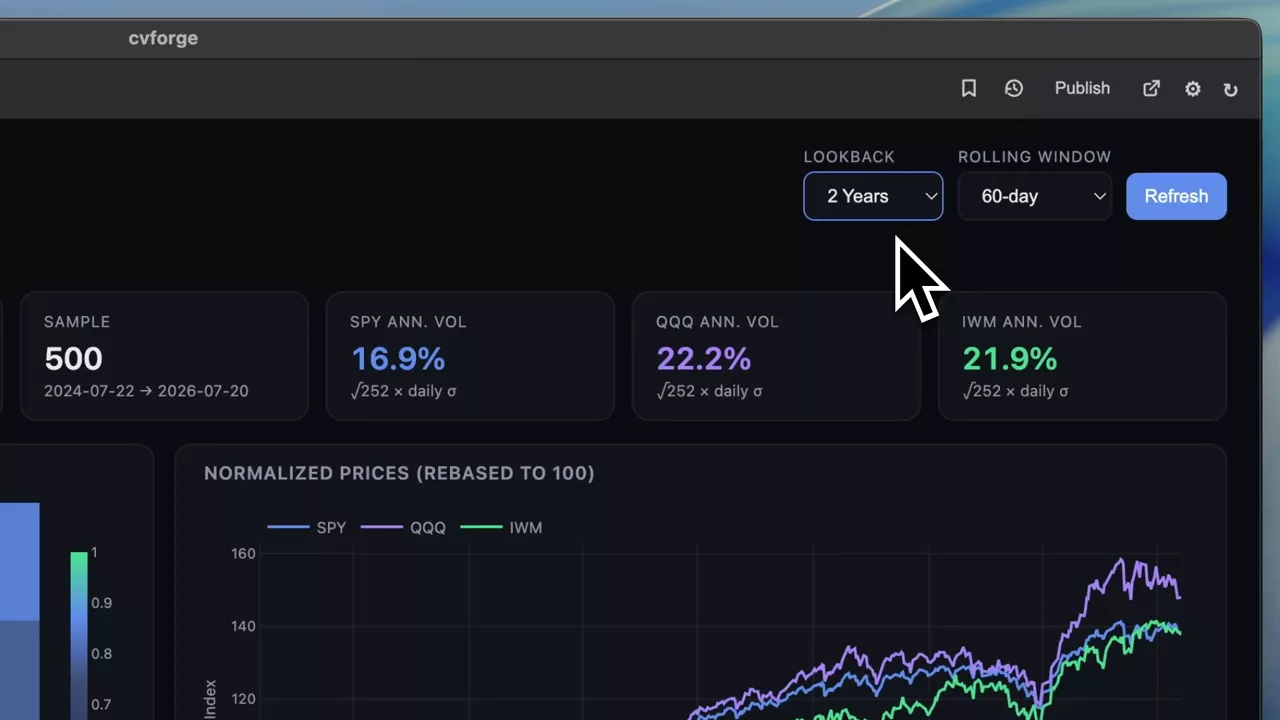
Daily price correlation between SPY, QQQ and IWM
A correlation dashboard for the three main U.S. index ETFs on daily returns, with rolling windows so you can see the relationship change rather than assume it holds.
SPY · QQQ · IWM
 0:39
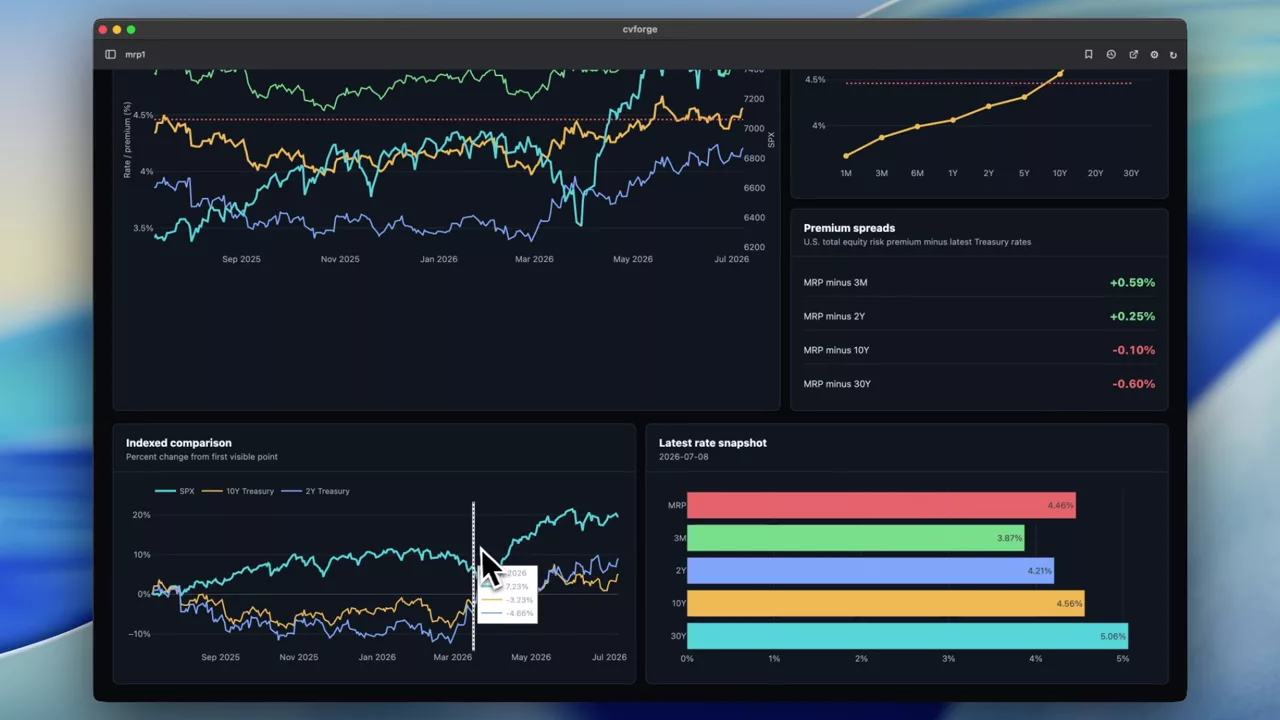
Market risk premium against treasury rates and SPX
The U.S. equity risk premium plotted against 2Y, 10Y and 30Y treasury yields and the SPX price, with the current yield curve alongside.
SPX
 0:56
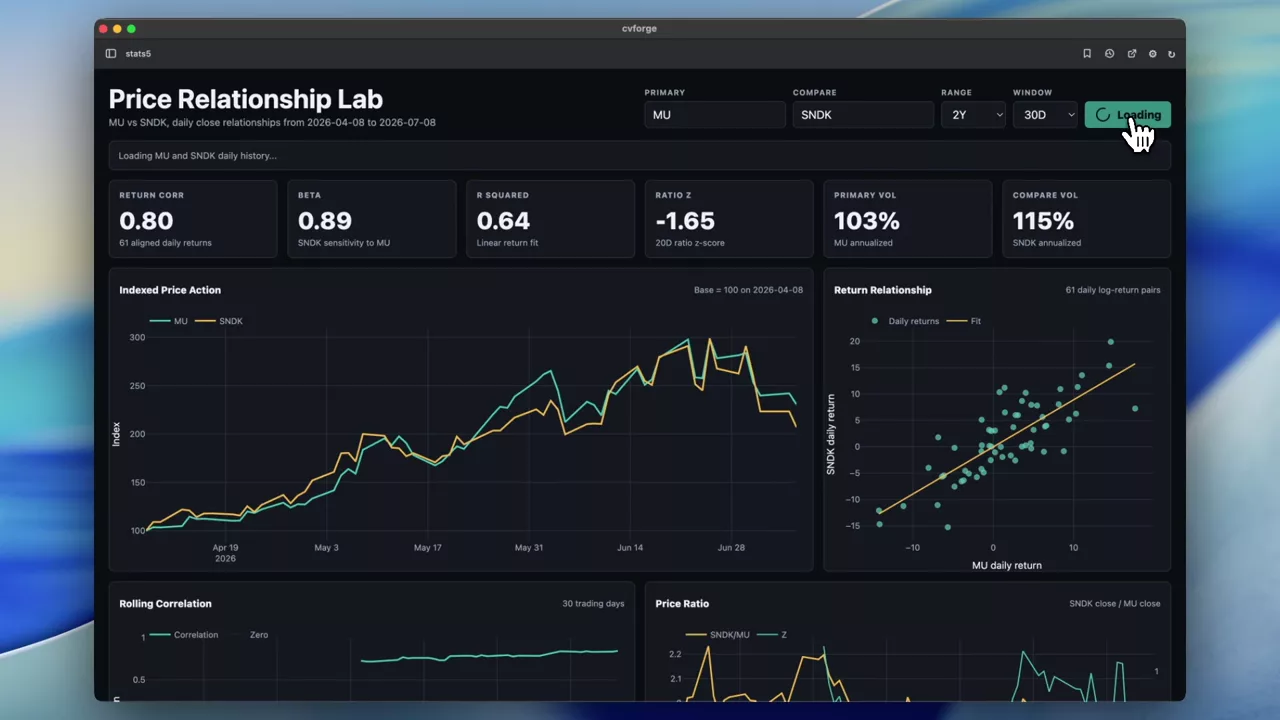
Comparing two stocks statistically: MU against SNDK
Beta, R², return correlation, a ratio z-score and rolling correlation for a pair of names over a year — the whole statistical relationship on one screen.
MU · SNDK
 1:08
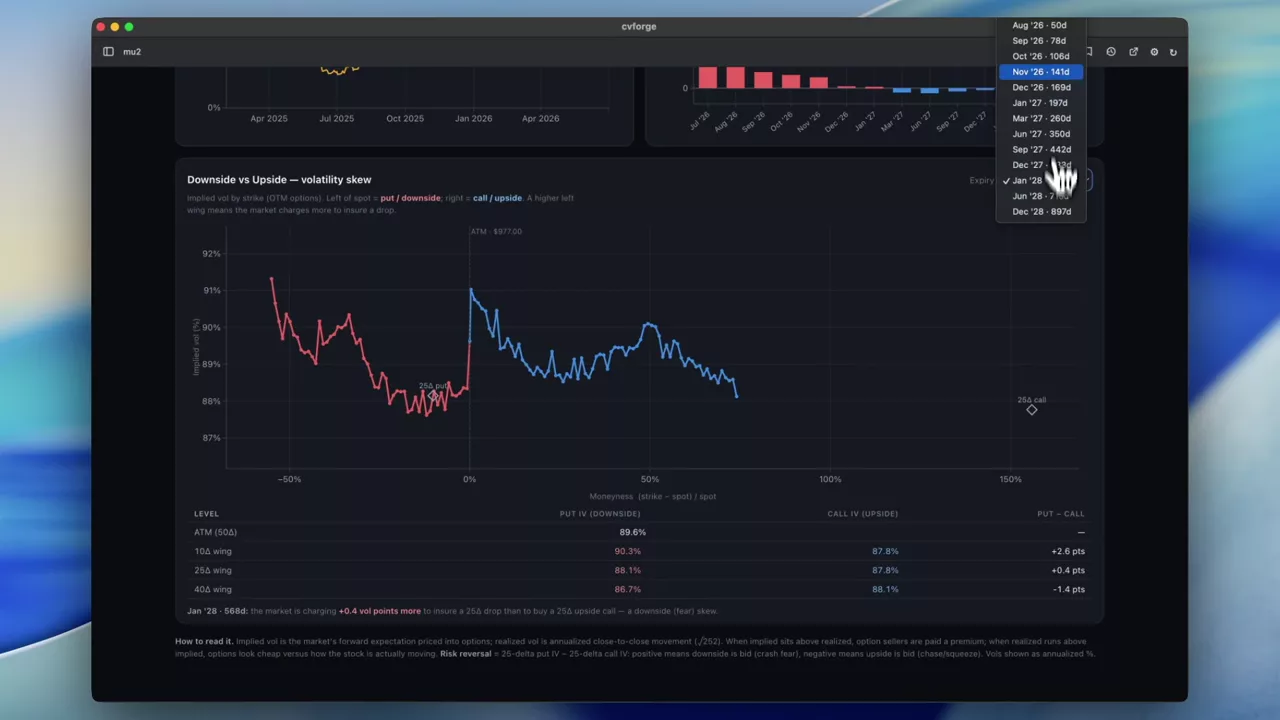
MU realised volatility against implied, upside versus downside
Where MU options are priced relative to how the stock has actually moved, split by side, so the question "are these expensive?" gets a directional answer.
MU
Fundamentals and company research
The non-options half of the data surface: financial statements, sankey flows, insider activity, estimates.
Read the guide →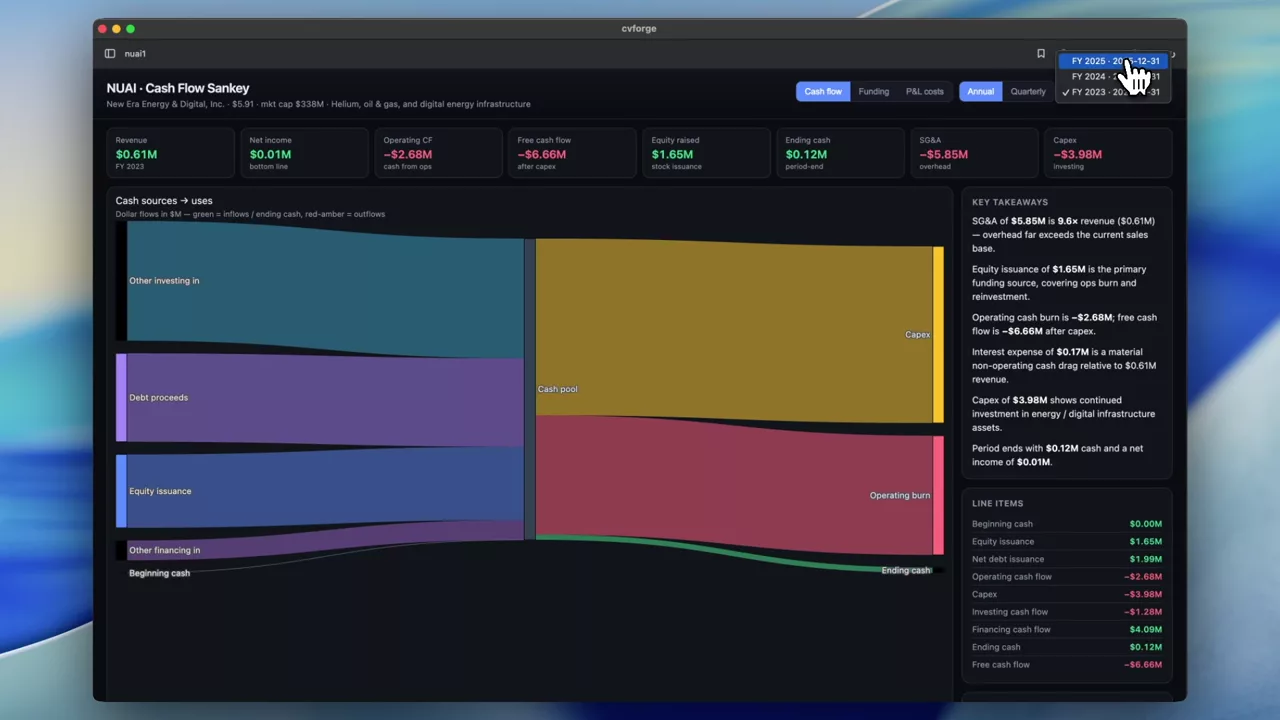 0:58
Tracing NUAI’s cash flows, revenue and costs as a diagram
A sankey built to answer a specific question about a smaller name: where the cash actually goes between revenue and the bottom line.
NUAI
 0:37
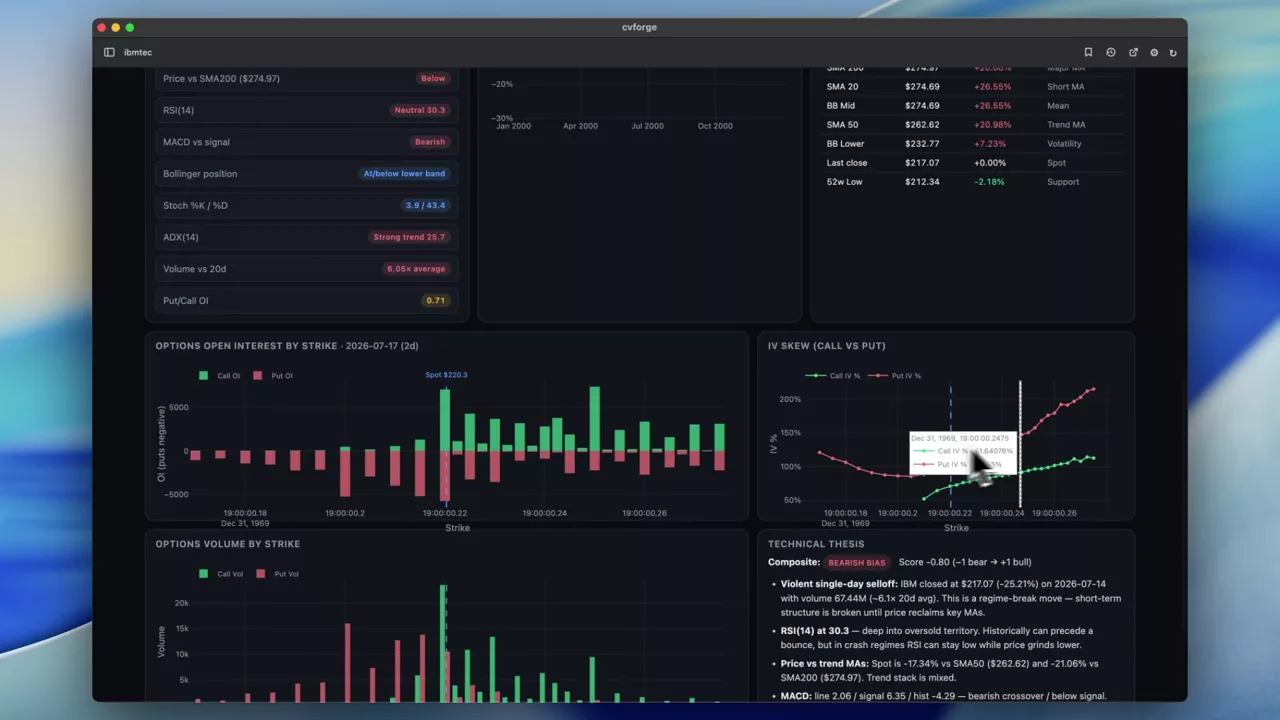
A full technical analysis of IBM from one sentence
Moving averages, momentum, trend and levels for IBM assembled into one technical read — built from a single prompt against historical price data.
IBM
 0:34
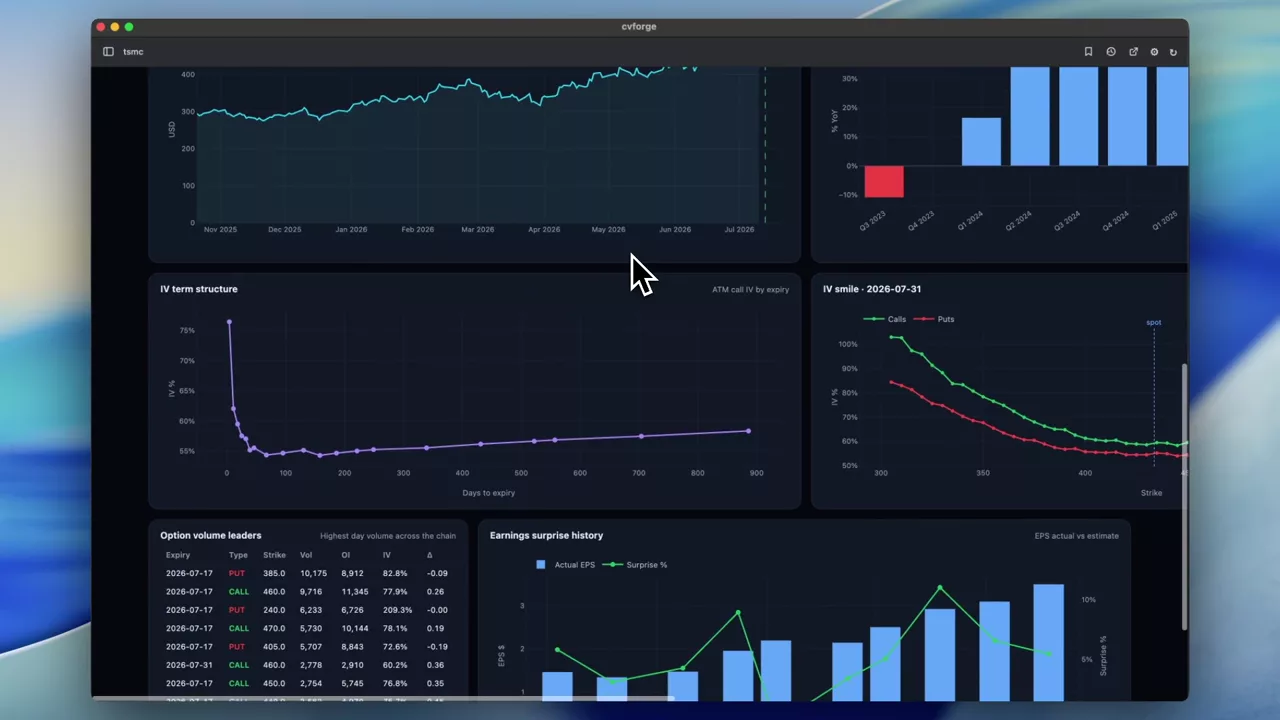
Fact-checking a revenue headline about TSMC
A news claim — "TSMC Q2 revenue jumps 36%, beating expectations" — turned into a dashboard that checks it against the reported statements and estimates.
TSMC
 0:31
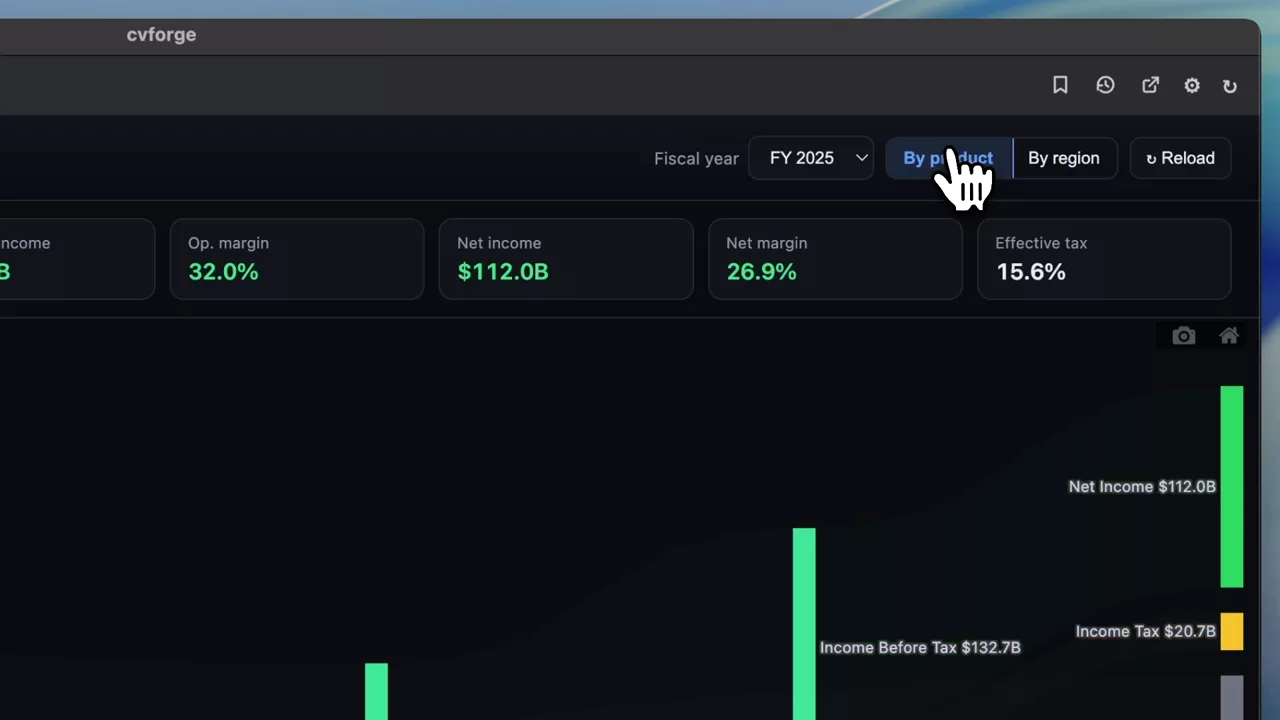
An AAPL income statement sankey from four words
"Generate a sankey diagram of $AAPL financials" — the whole prompt — produces a full revenue-to-income flow diagram for Apple.
AAPL
 0:45
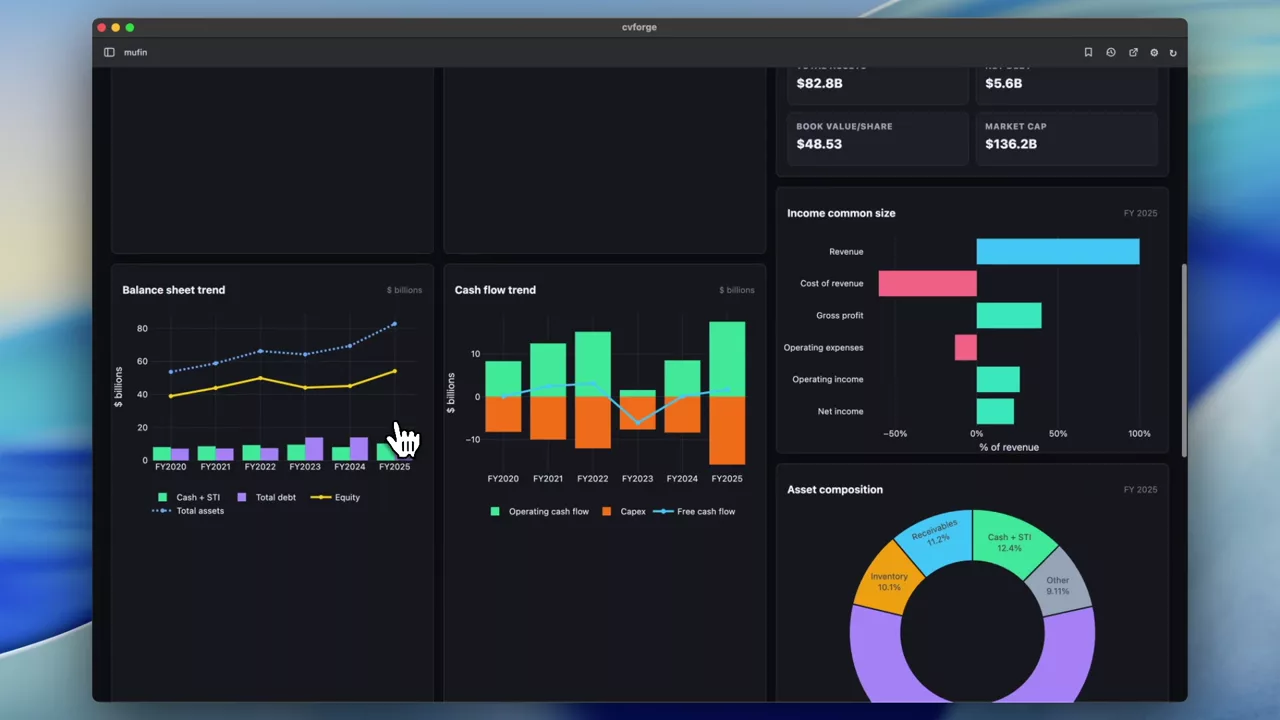
MU’s latest financial statements, visualised
Micron’s income statement, balance sheet and cash flow rendered as charts instead of tables, so the trend in each line is visible at a glance.
MU
 0:28
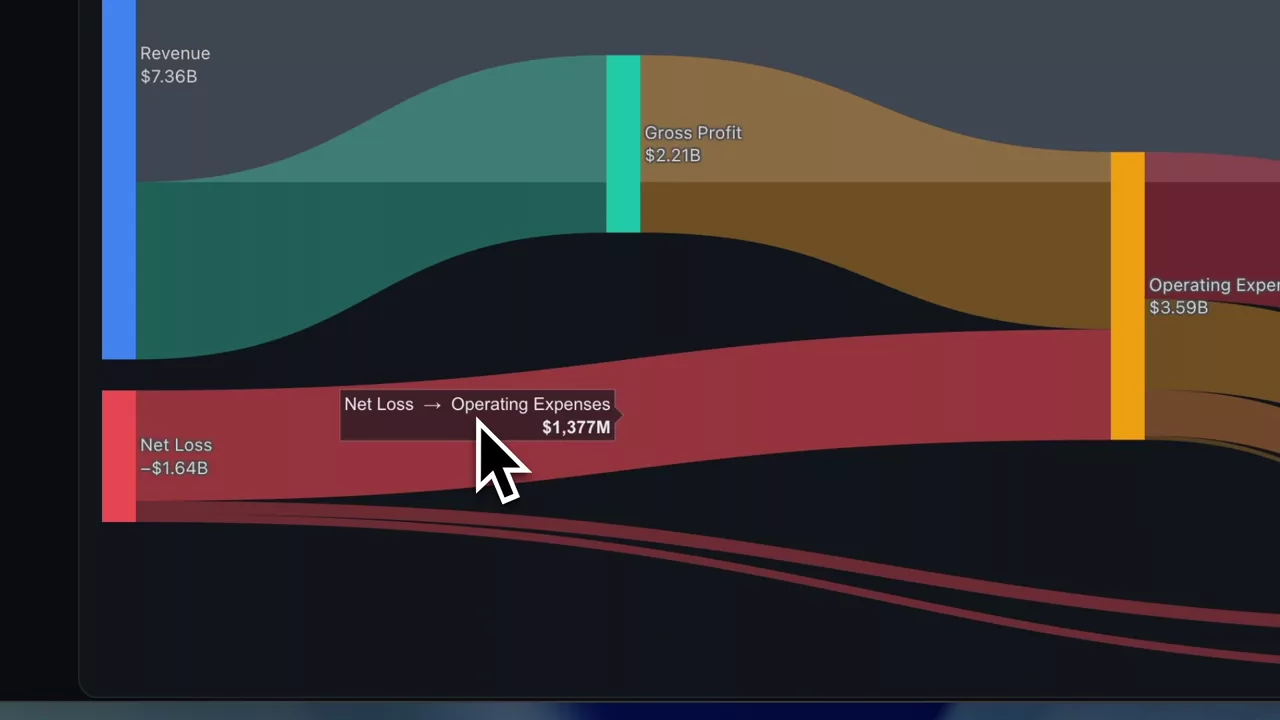
SNDK financials as a sankey: revenue through to net income
Sandisk’s latest quarter drawn as a flow diagram — revenue in, each cost taking its slice, income out — so the shape of the P&L is the shape of the chart.
SNDK
 0:32
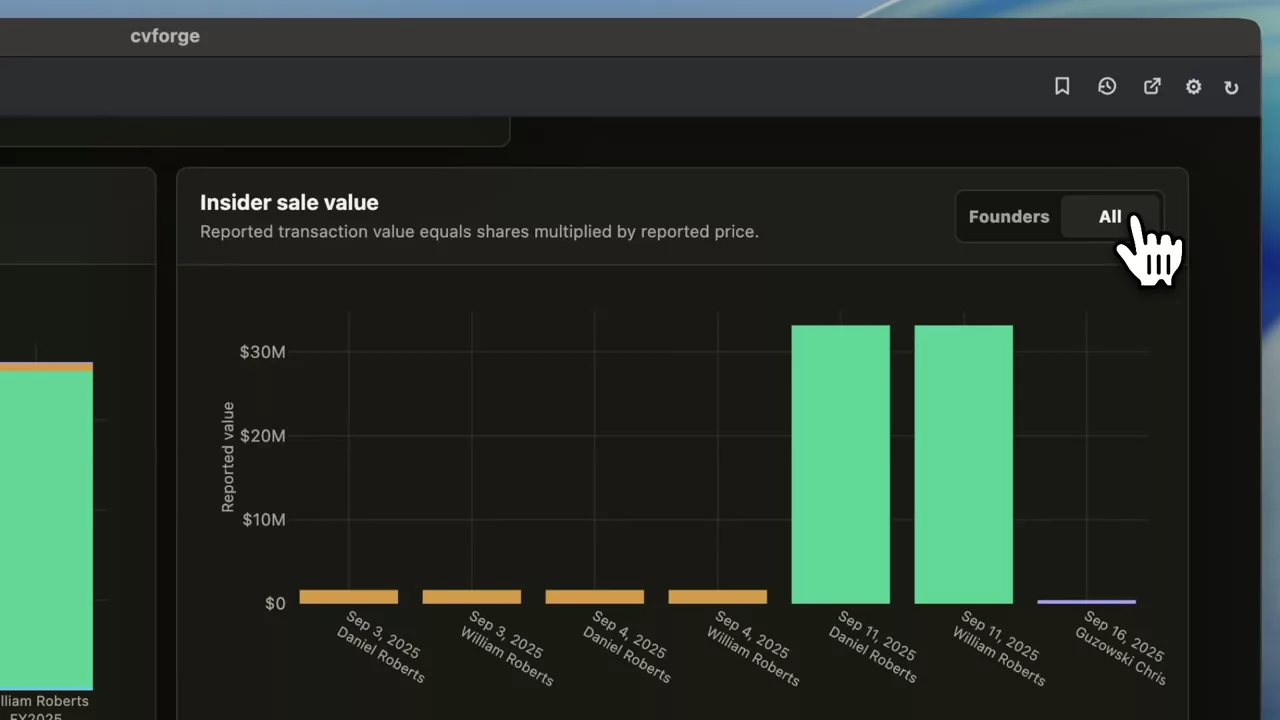
IREN founder pay and insider selling against the share price
Founder compensation and insider sales plotted with IREN’s price — filing data and market data on one screen, which is where the comparison becomes interesting.
IREN
 0:36
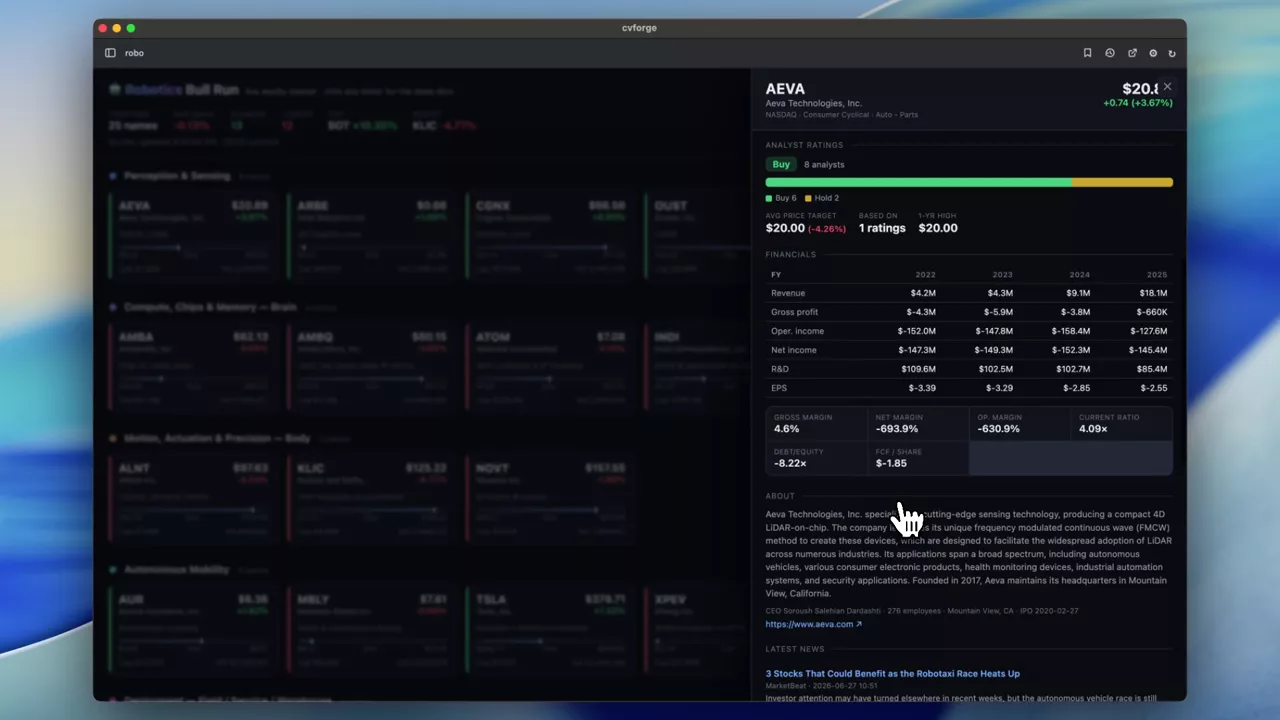
A watchlist that fetches research on click
Tickers organised into groups where selecting one pulls its news, analyst ratings, financials and price — a research launcher rather than a static list.
 0:55
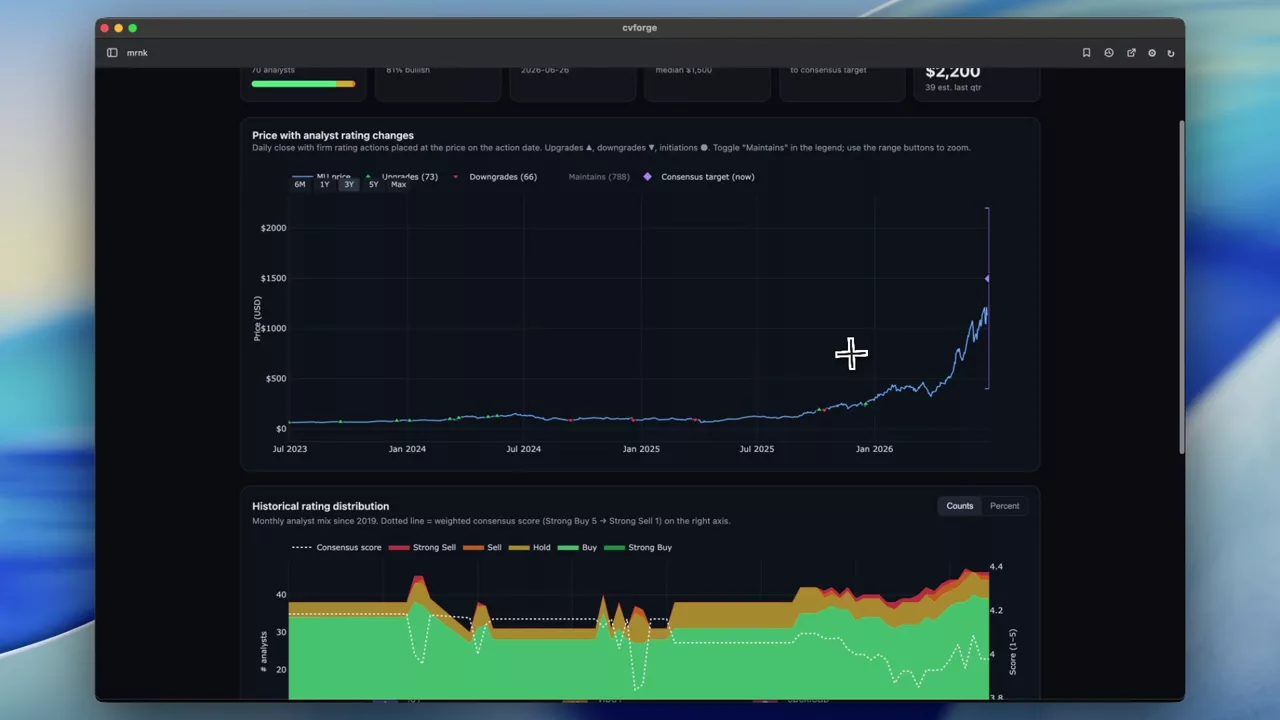
MU analyst ratings history against the share price
Micron’s current and historical analyst ratings plotted against its price, which shows how the consensus moved relative to the stock rather than ahead of it.
MU
Whole-stock research dashboards
One screen per name pulling price action, options activity, news and fundamentals together.
Read the guide →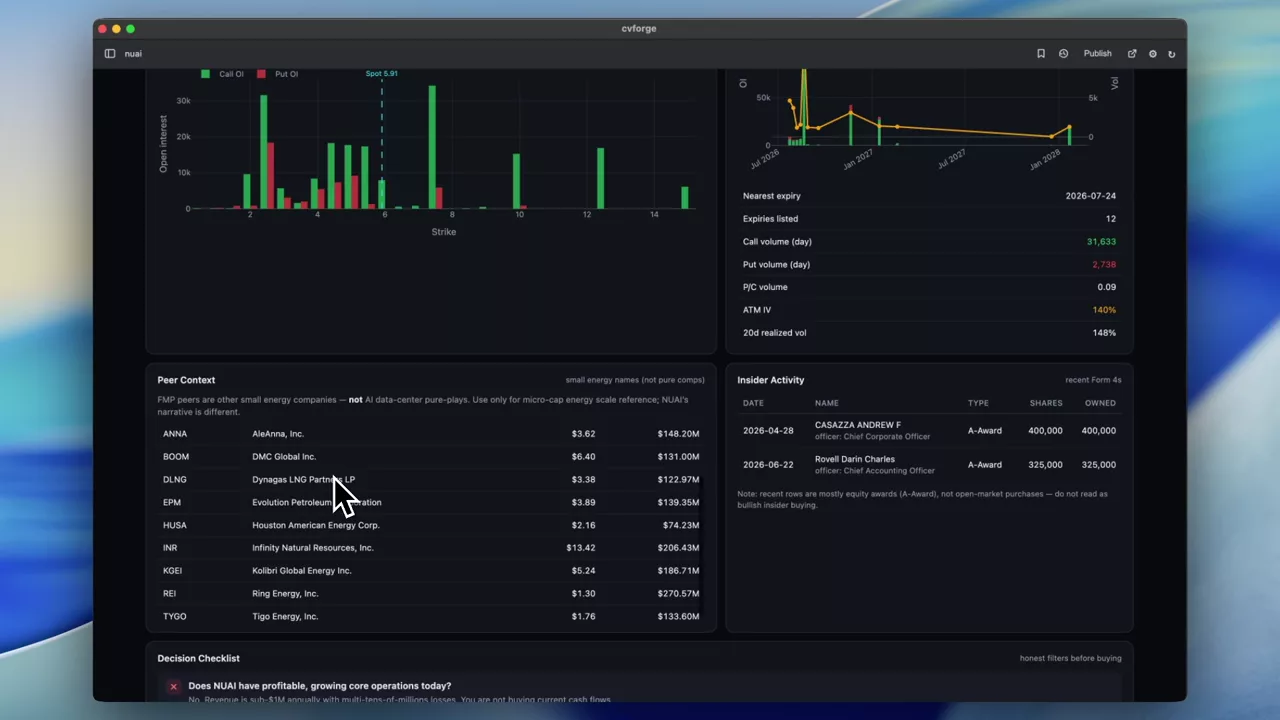 1:40
Everything on one screen before buying a stock
A deliberately open prompt — explain everything I need to know about NUAI — and the research dashboard it produced across price, options, fundamentals and news.
NUAI
 0:45
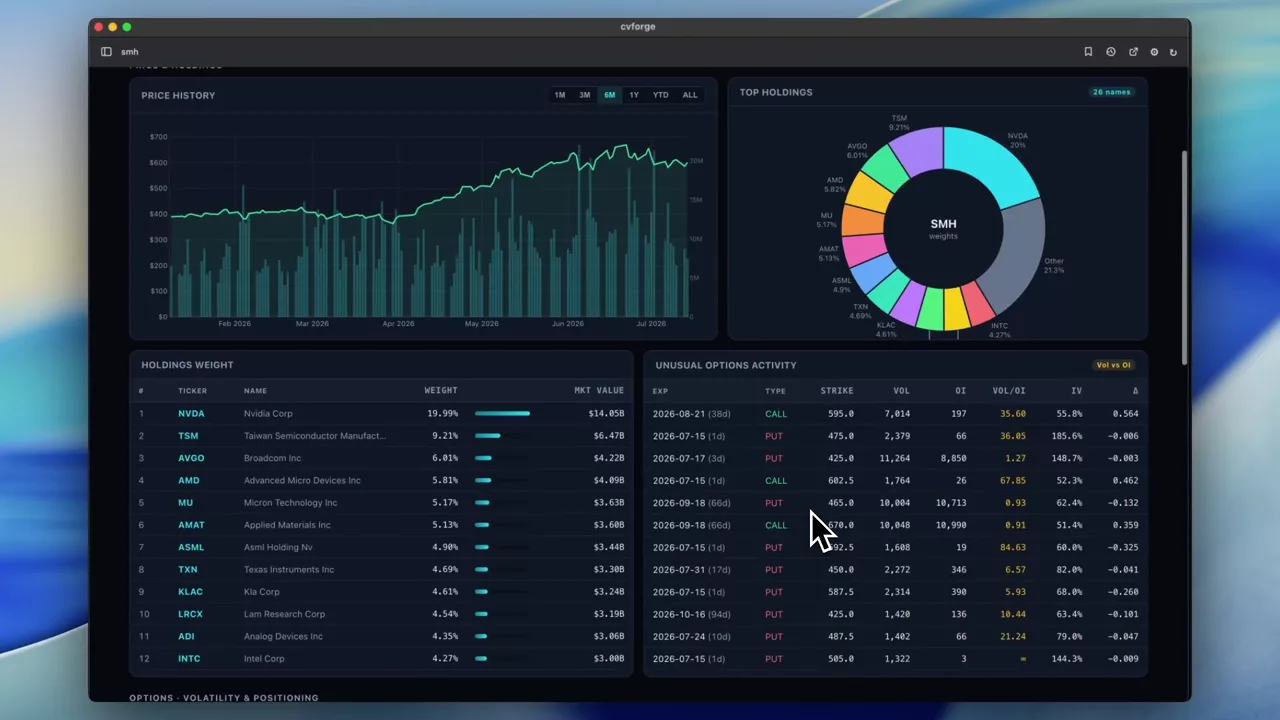
A full dashboard for the SMH semiconductor ETF
An ETF-level research dashboard for SMH, where the option chain and the fund’s own behaviour matter more than any single company’s statements.
SMH
 0:48
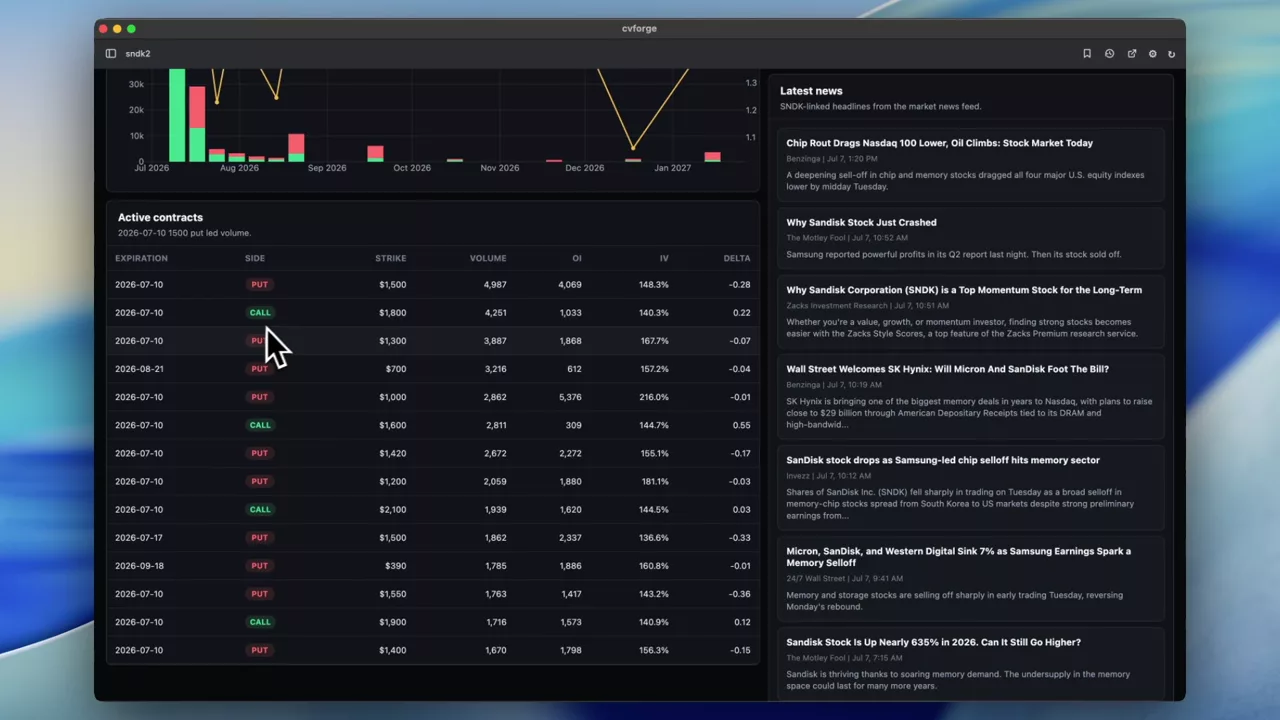
SNDK price action, option activity and volatility together
A four-part overview of Sandisk — price, option activity, volatility and news — built during a sharp drawdown in the name.
SNDK
 0:28
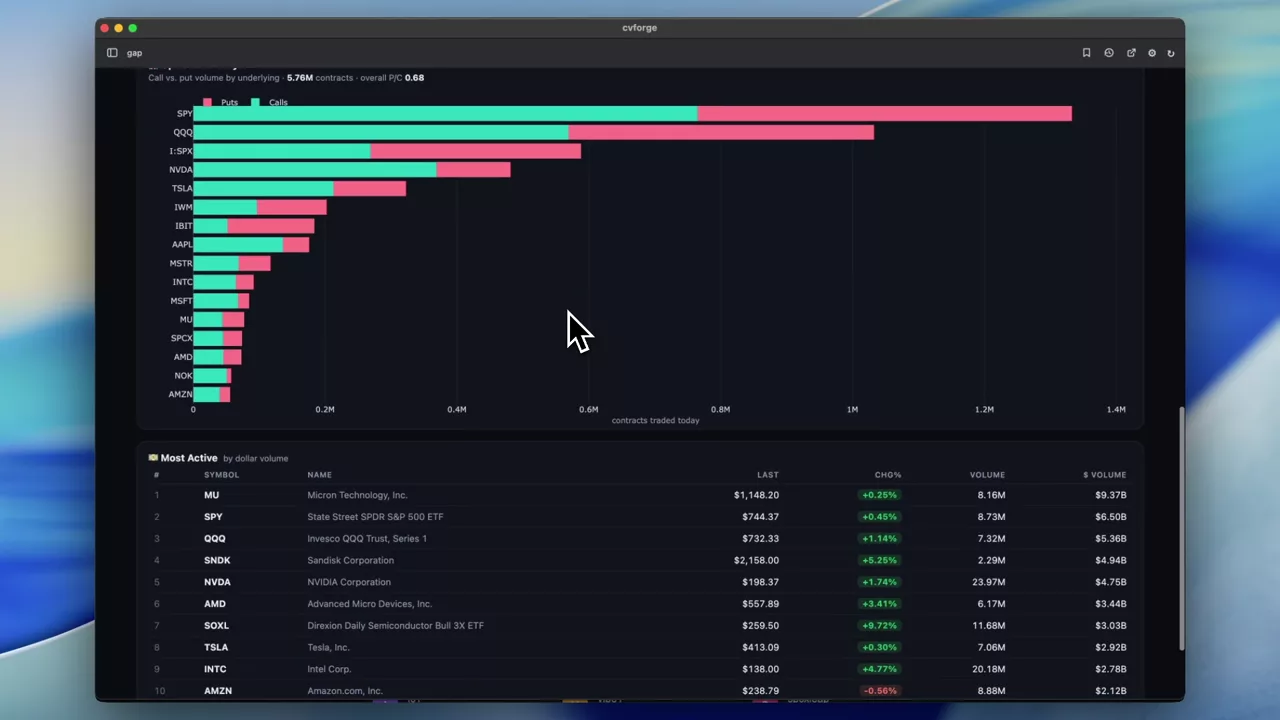
Today’s movers: gap ups, winners, losers and option activity
A market-wide board of the day’s notable names — gaps, biggest gainers and losers, and where option activity is elevated — instead of a single-ticker view.
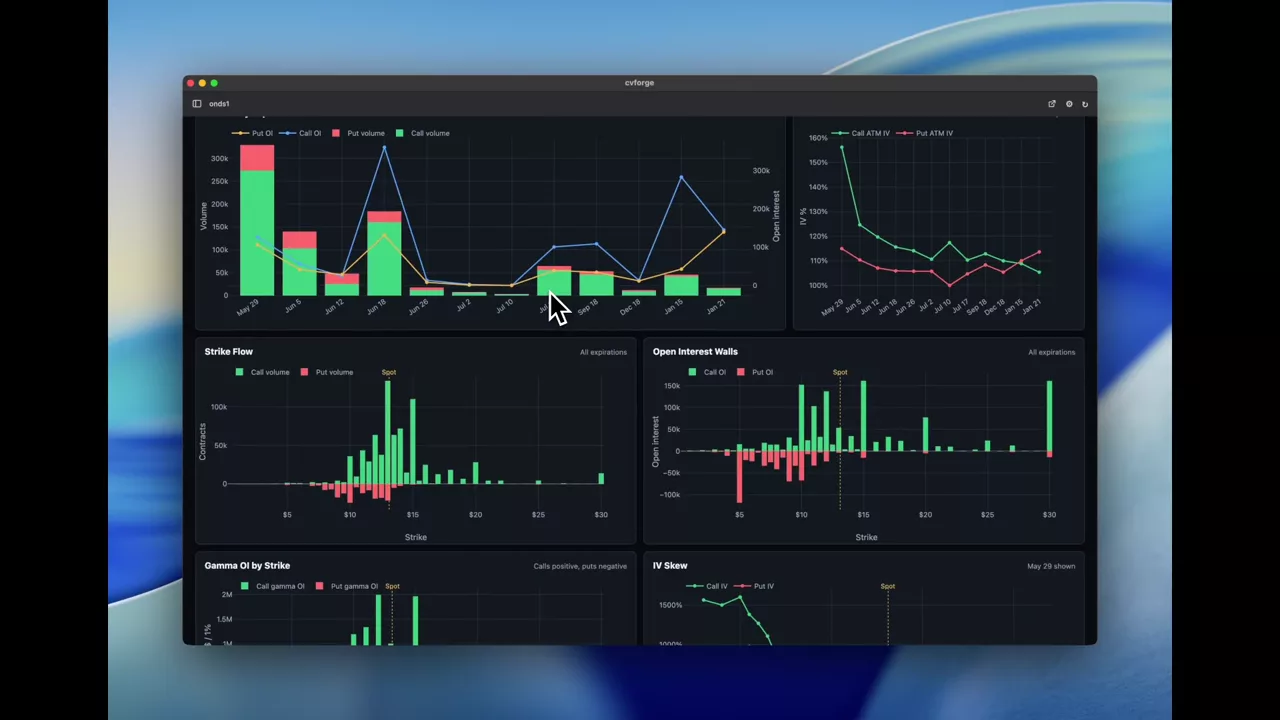 1:12
A complete option-activity overview for ONDS
Volume, open interest, call/put ratios, volume-against-OI, premium estimates and the top strike and expiration for a single name — assembled live from one prompt.
ONDS
Macro and economic dashboards
Economic releases and rates set against index options.
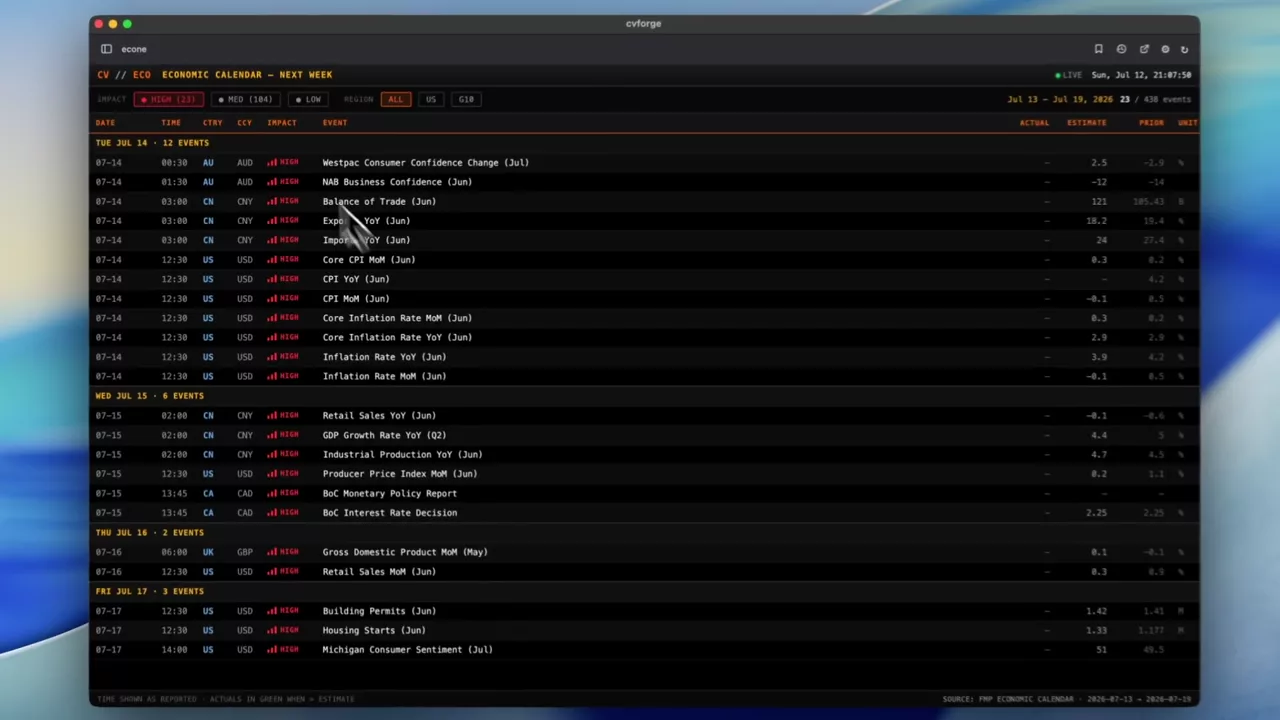 0:43
Next week’s economic calendar as a terminal-style table
The coming week’s significant economic releases laid out as a dense, scannable table — the format a professional terminal uses, built from one sentence.
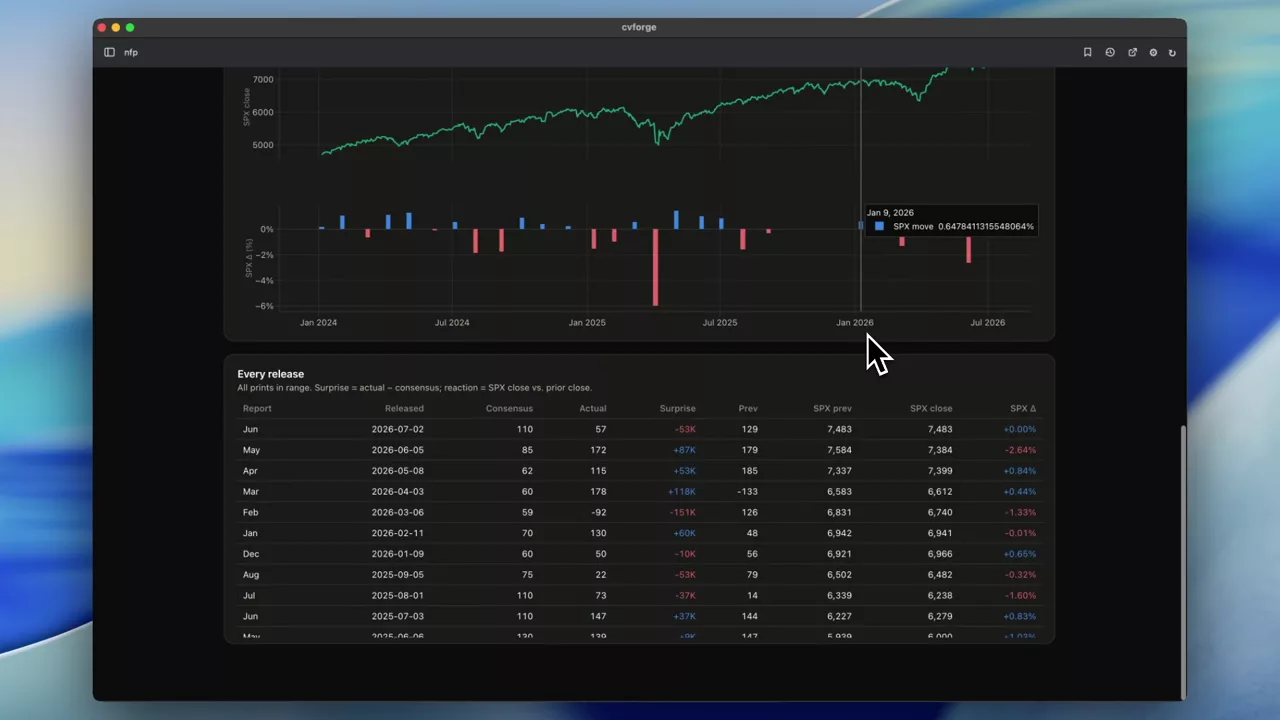 0:31
Non-farm payrolls against SPX: expected versus actual
Every recent payrolls print — consensus against actual — aligned with SPX closes, with a scatter and regression to test whether the surprise explains the move.
SPX
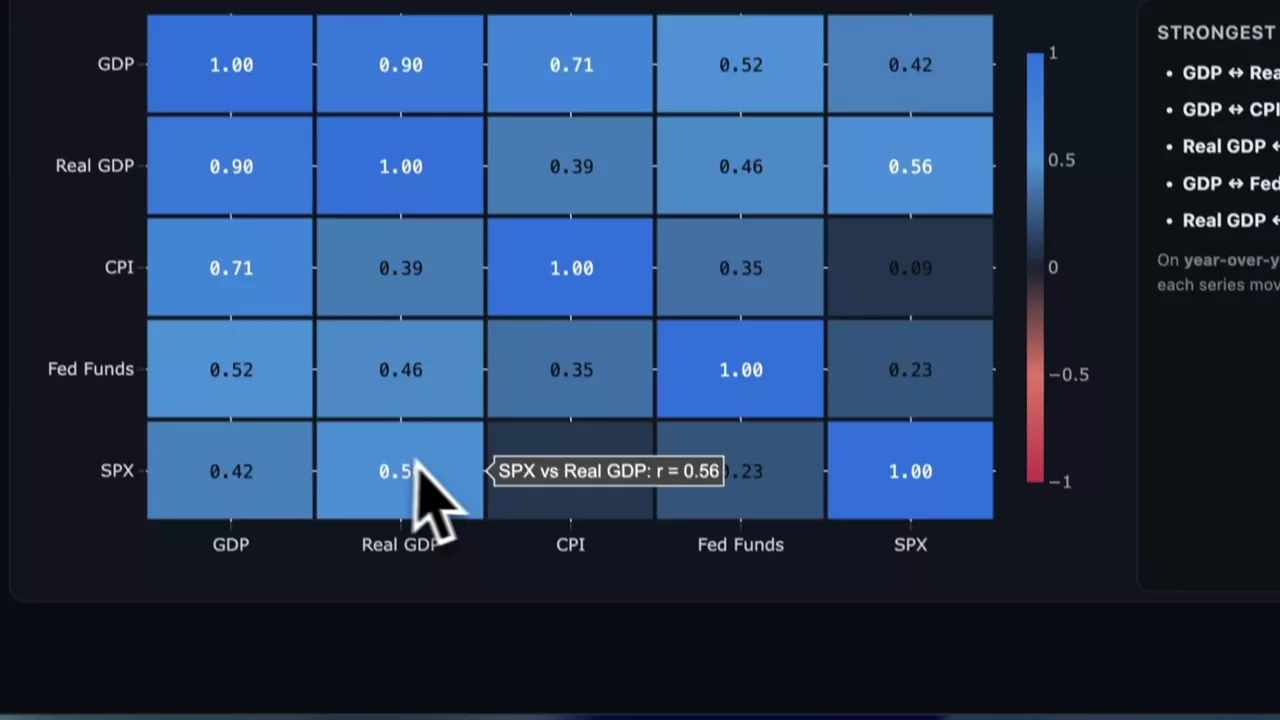 0:35
Twenty years of GDP, CPI and Fed funds against SPX
GDP, real GDP, the federal funds rate and CPI over two decades on one chart with SPX alongside, to look for statistical relationships across a full cycle.
SPX
Learning options with live data
Tools built to explain a mechanic rather than to trade it, using Massive FMV estimates instead of executable quotes.
 4:38
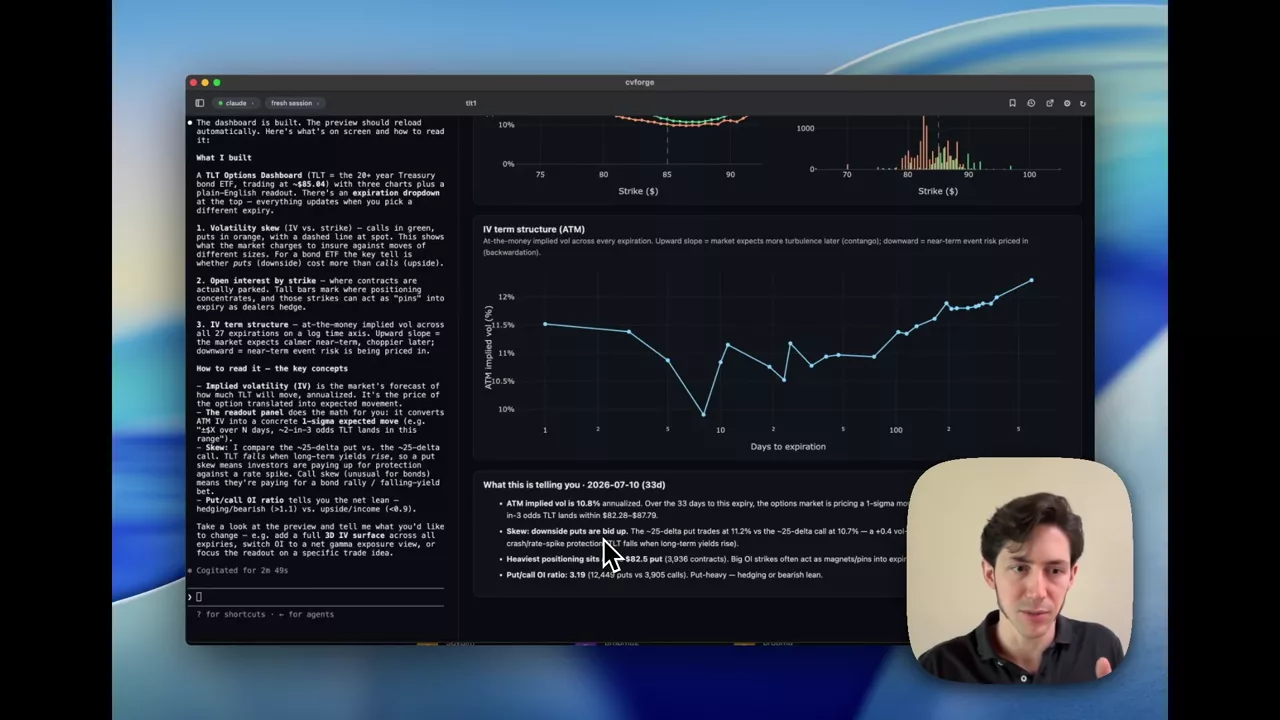
Reading the TLT option chain when you don’t know where to start
A visualisation of TLT options built to explain itself: what the chain contains, which numbers matter, and what they say about expectations for long bonds.
TLT
 2:09
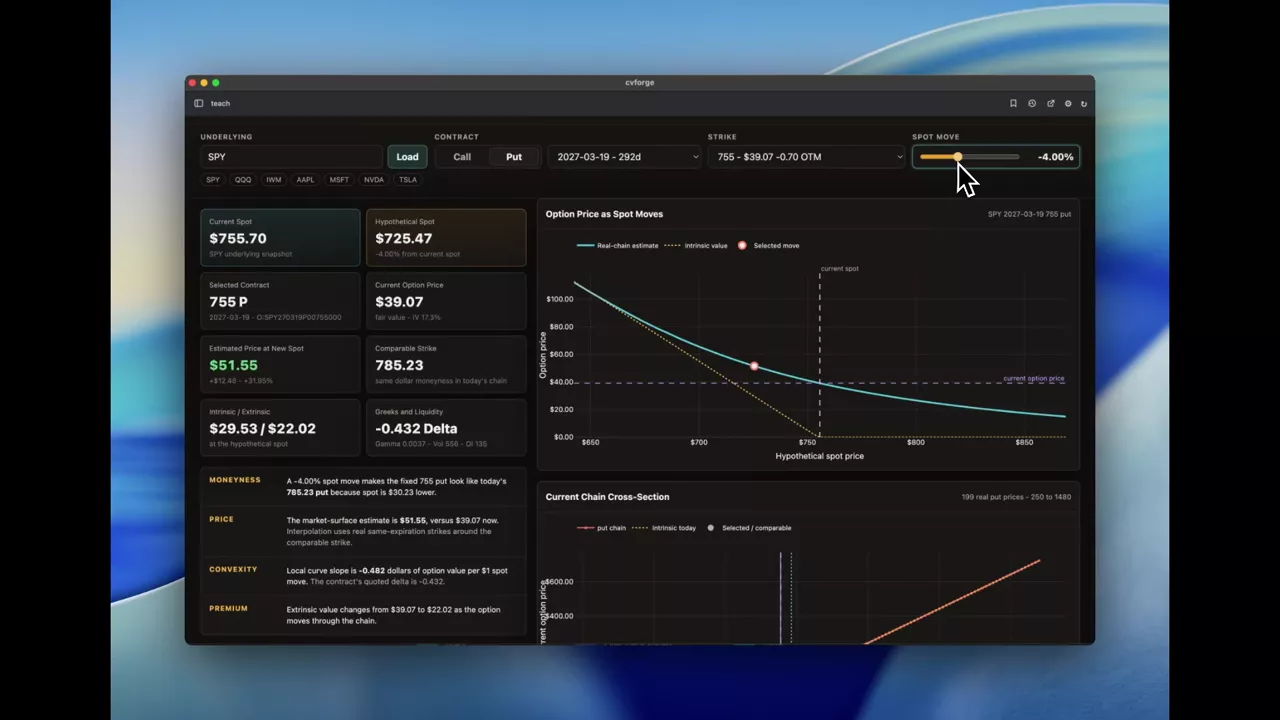
How an option’s estimated value moves with spot, using FMV
A teaching tool that interpolates the live chain to show what a contract would be worth at different spot prices — the delta and gamma relationship, with real numbers.
Single-ticker activity dashboards
A general read on one name’s option activity: what is trading, where, and in which direction.
Read the guide →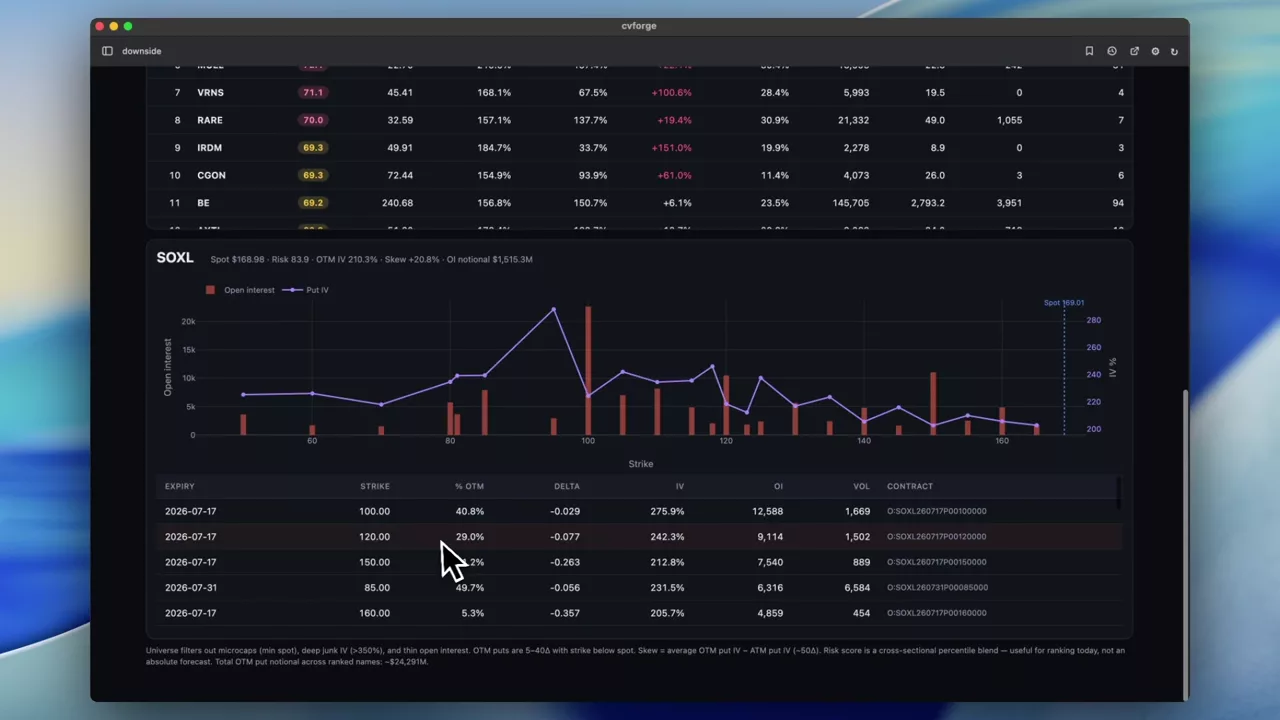 0:28
Finding the names with the most elevated downside risk priced in
A market-wide scan of out-of-the-money put activity to surface which stocks currently have the most downside being paid for.
SOXL
 0:53
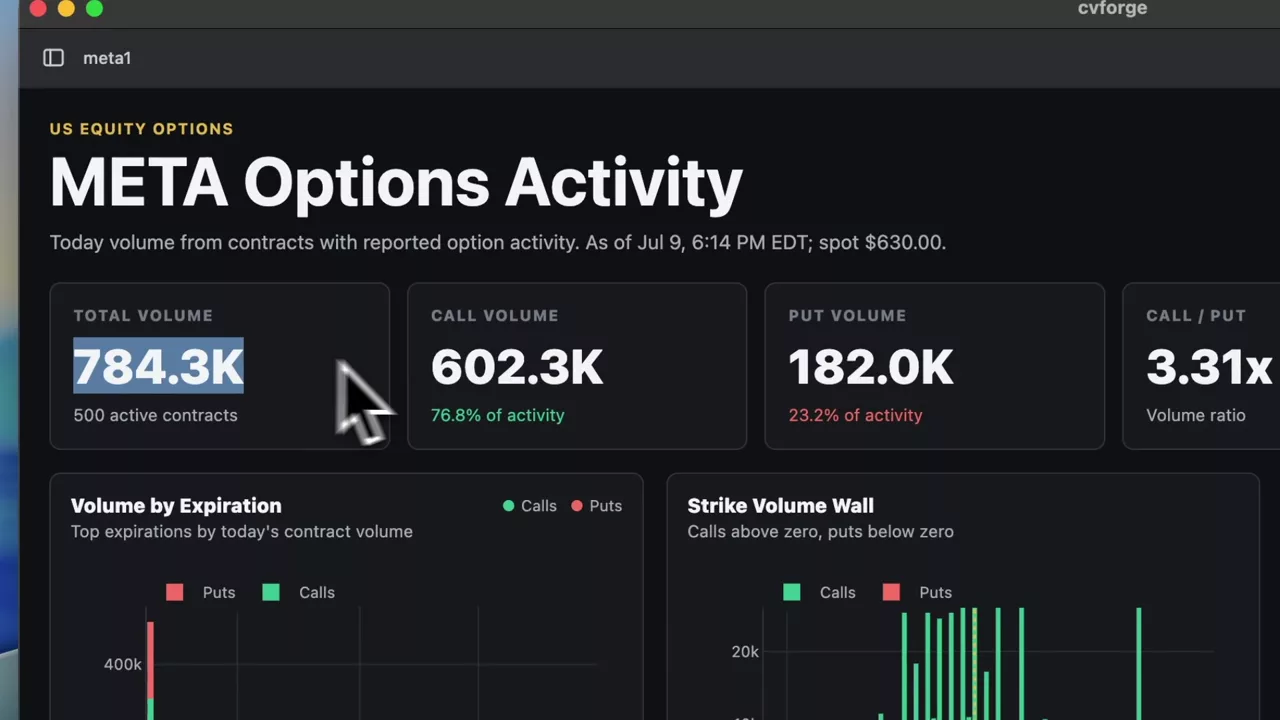
META’s option activity for the current session
A clean single-session read on META options: what traded, at which strikes and expirations, and how that sits against existing open interest.
META
 0:25
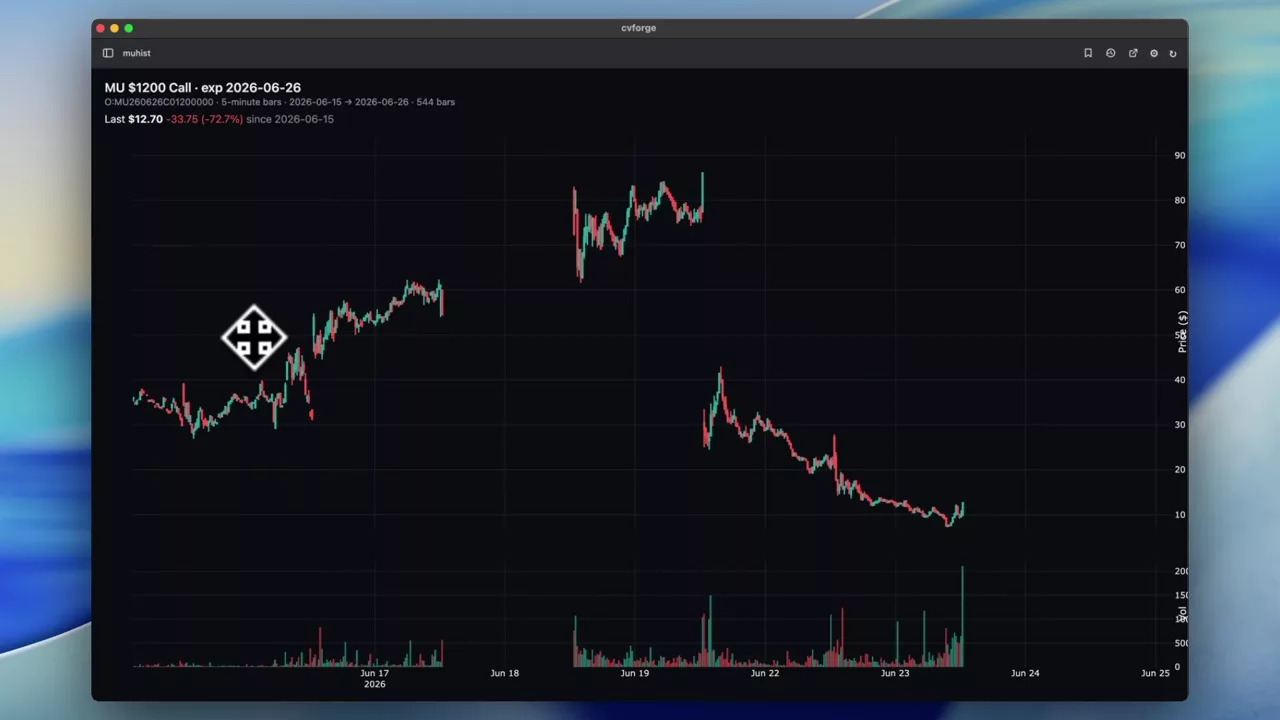
Five-minute bars on a single MU option contract
Intraday bars for one specific contract — the MU 1200 call expiring tomorrow — charted over the past week rather than the underlying stock.
MU
 1:11
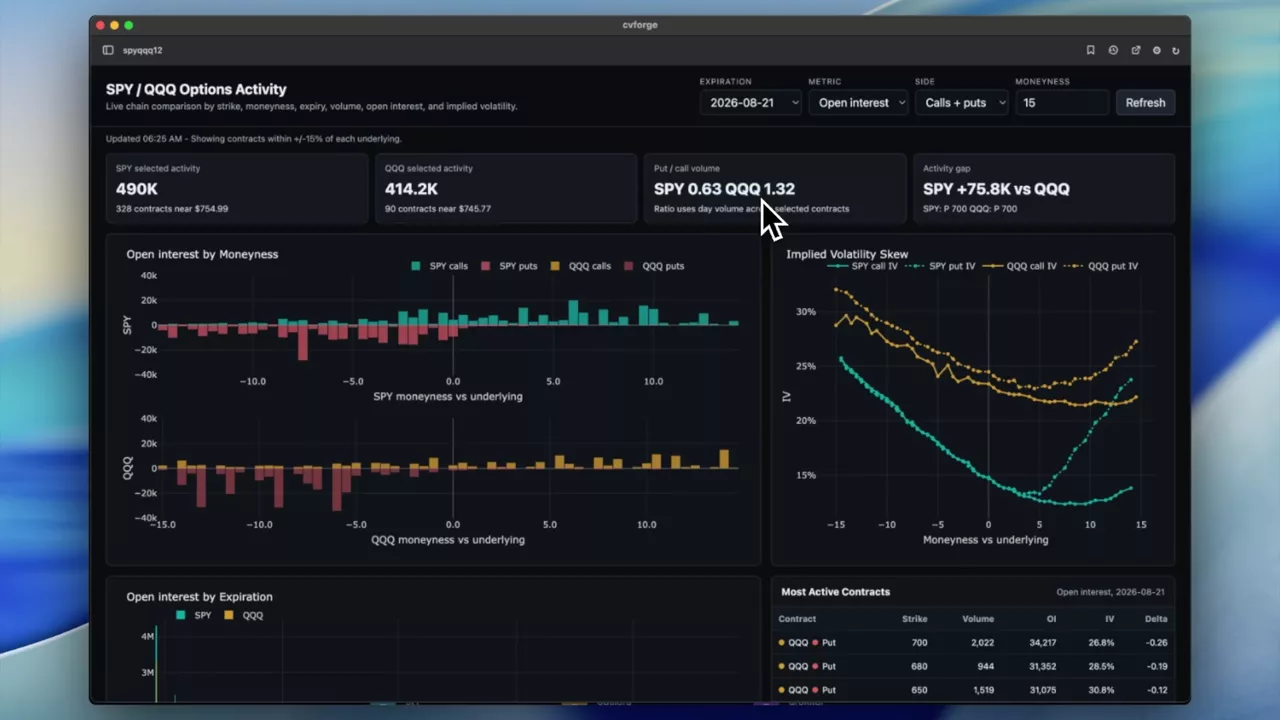
SPY against QQQ option activity on one dashboard
The two most heavily traded option markets in the world compared directly — volume, open interest and where activity sits relative to spot.
SPY · QQQ
 0:46
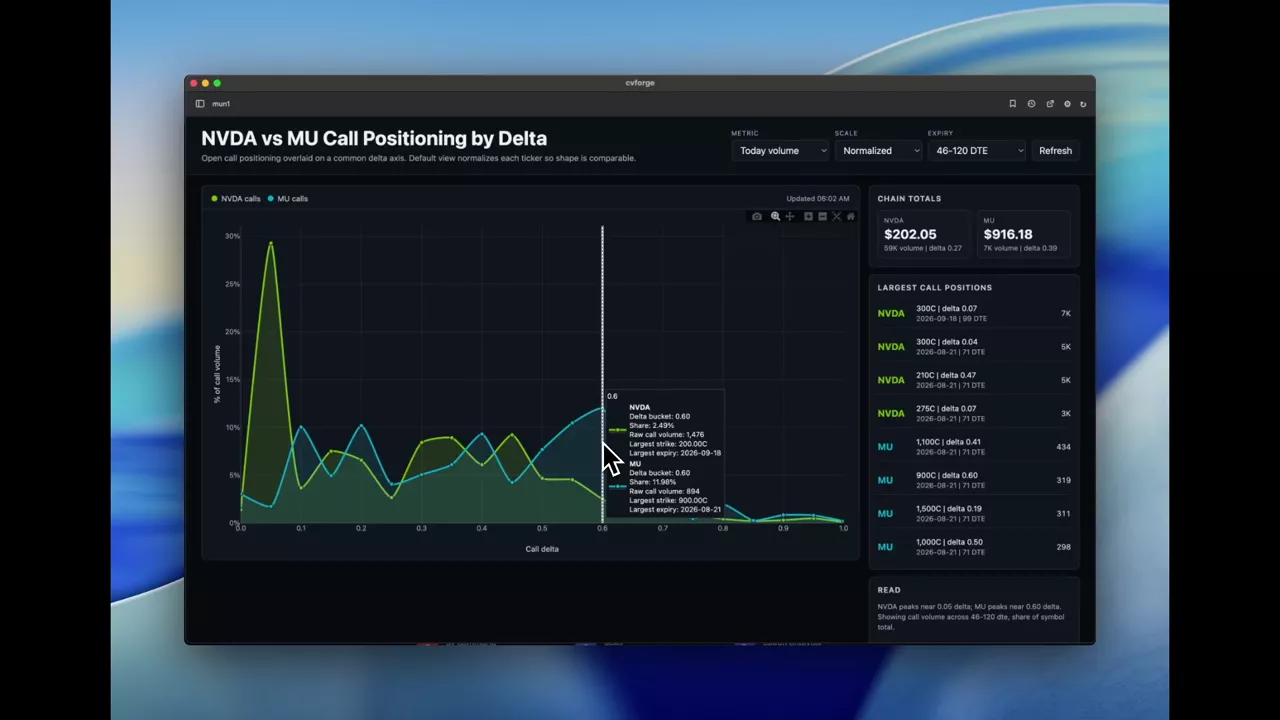
NVDA and MU call positioning overlaid on a delta axis
Two names’ call positioning on one chart using delta rather than strike for the x-axis — the change that makes stocks at different prices comparable.
MU · NVDA
 1:17
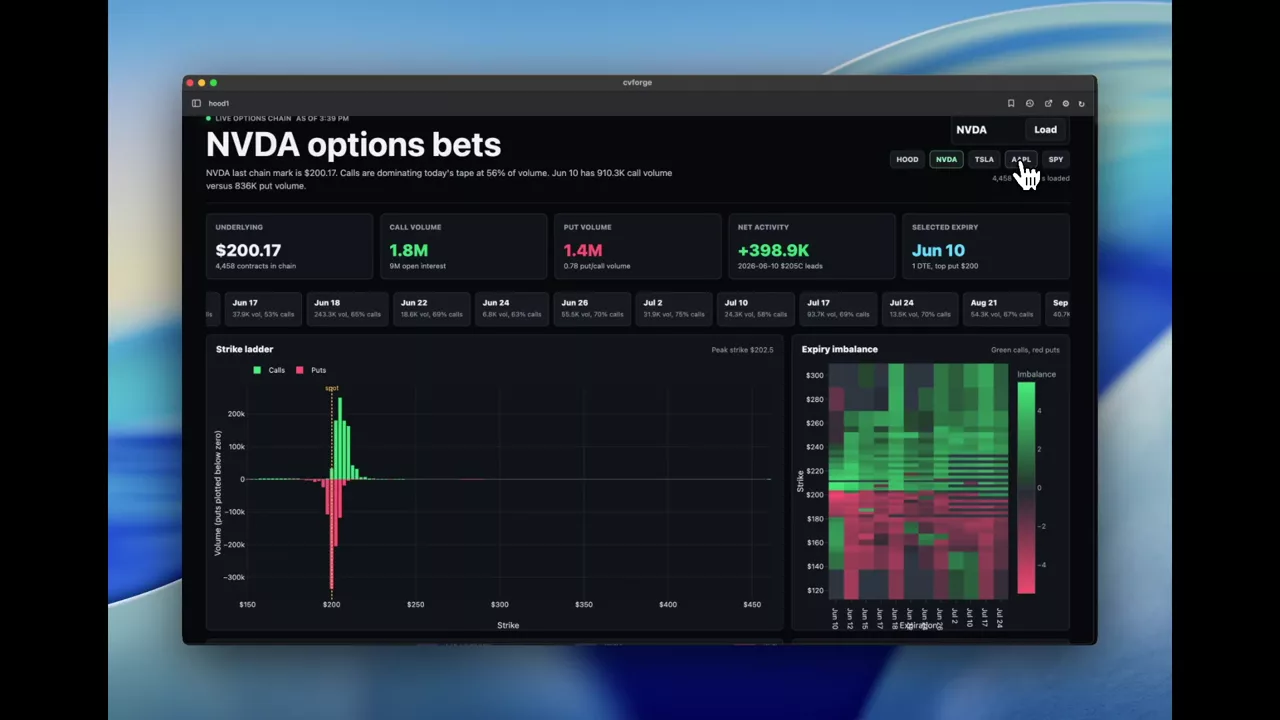
What HOOD option traders were positioned for on a green day
Built in the moment: HOOD was one of the few names up on the day, so the prompt asks what the option activity says about what traders expect next.
HOOD
 0:57
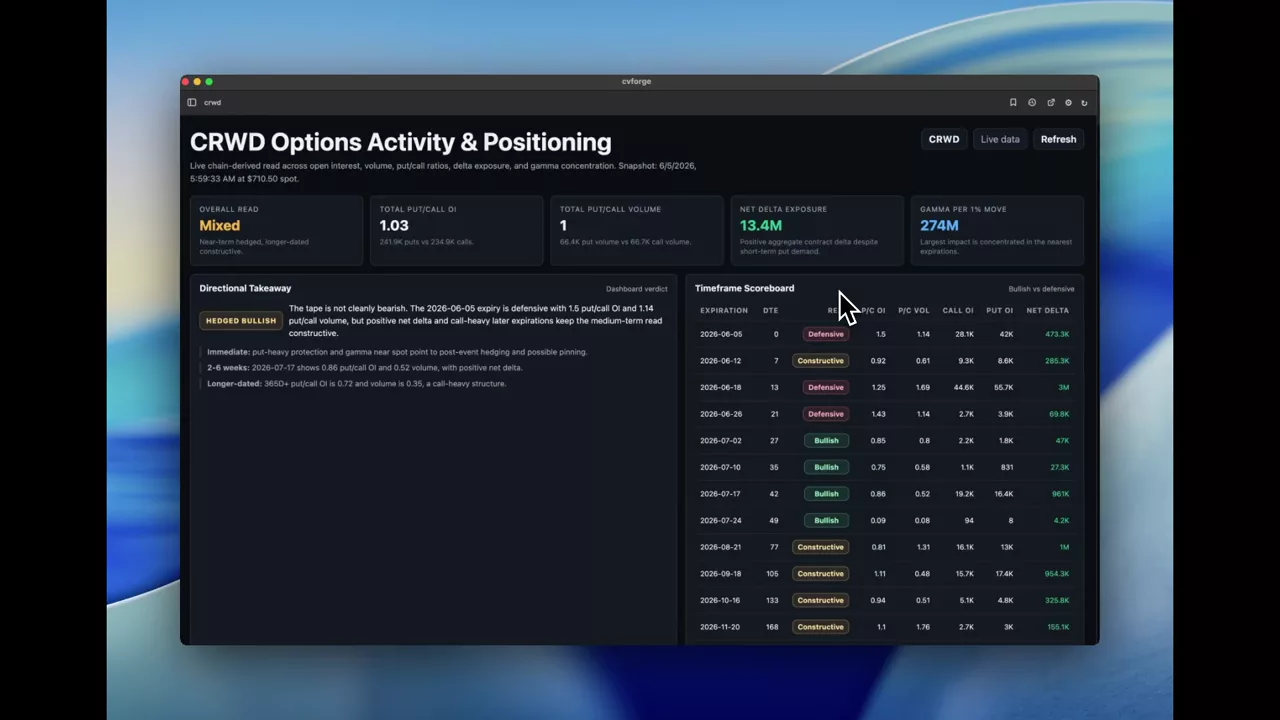
Is CRWD option positioning bullish or bearish, and over what horizon
Put/call ratios by timeframe, gamma concentration, strike positioning and the most active contracts for CRWD, arranged to answer a directional question.
CRWD
 0:46
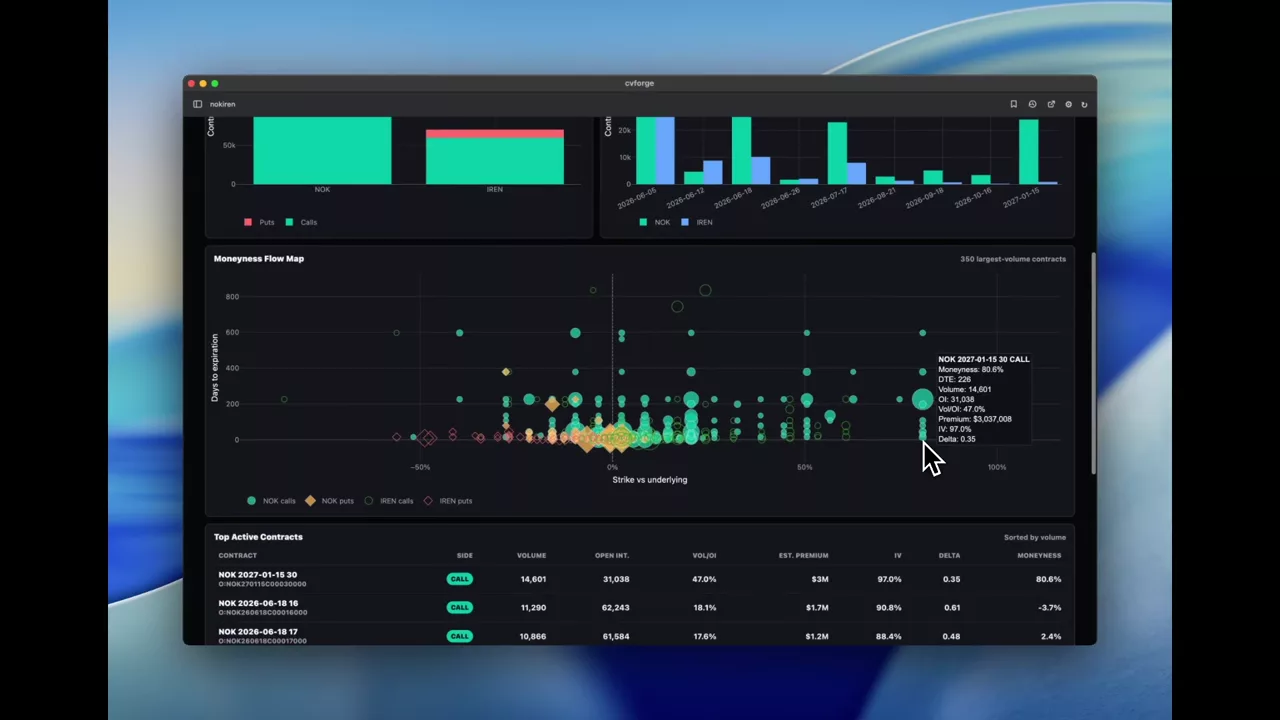
NOK against IREN: two very different option profiles
A comparison between two names whose option markets look nothing alike, which is what makes the contrast in activity and pricing instructive.
NOK · IREN
 1:53
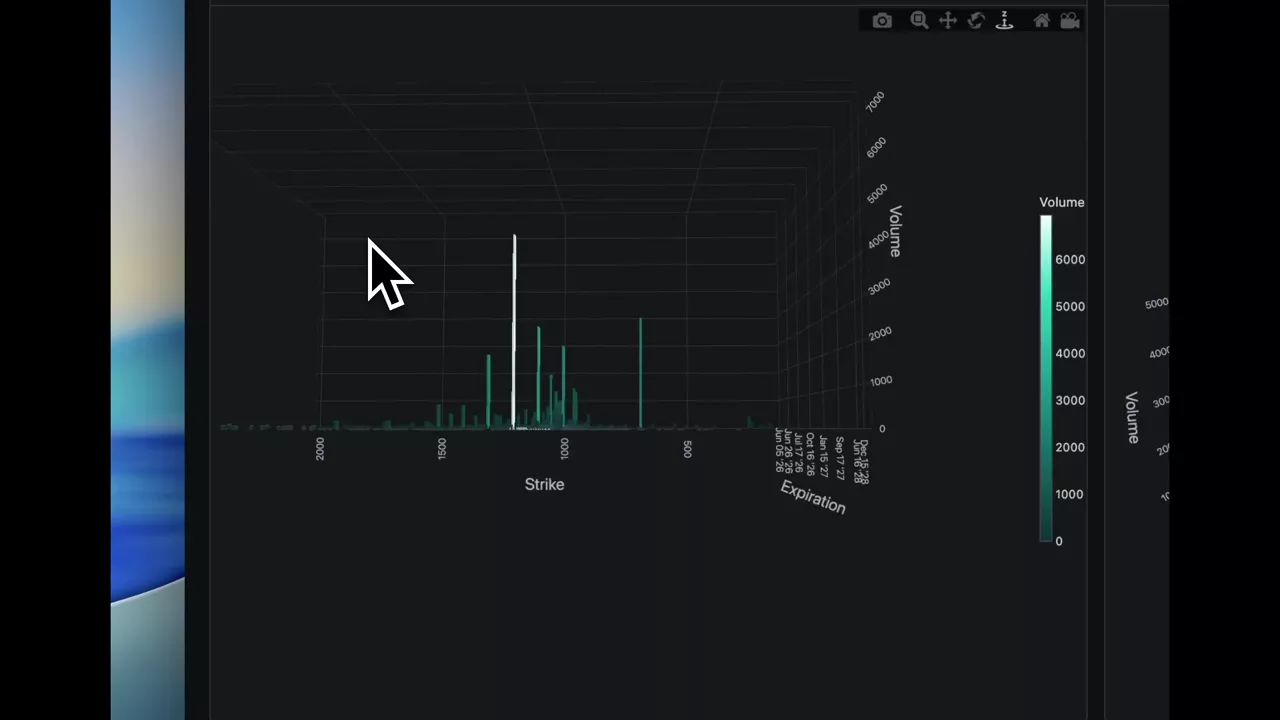
MU option volume as a 3D surface over strike and expiration
Volume plotted as a function of both strike and expiration in three dimensions, with call and put bar charts alongside, parameterised to take any ticker.
MU
 0:40
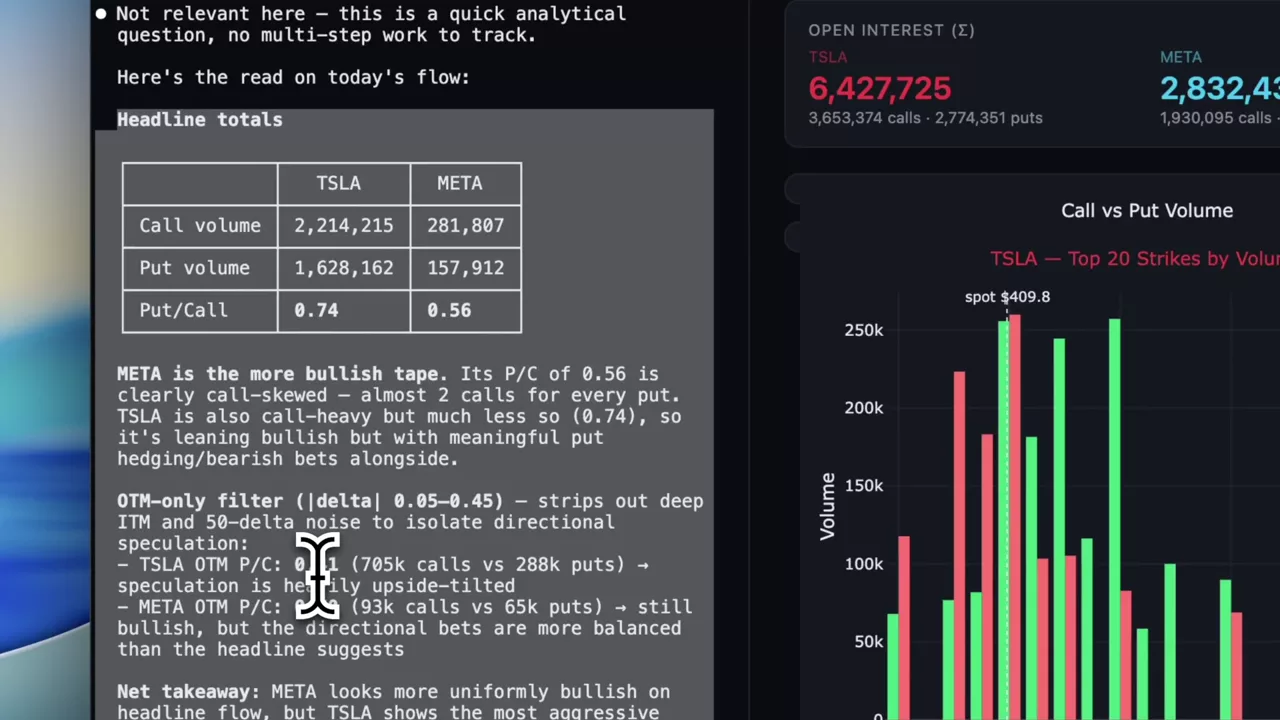
TSLA against META on today’s option volume
A two-name option volume comparison, followed up by asking the agent to interpret it — which is where having the data and the model in one place pays off.
TSLA · META