See open interest by strike for any ticker — built from a prompt
Written and reviewed by ConvexValue · Updated July 15, 2026
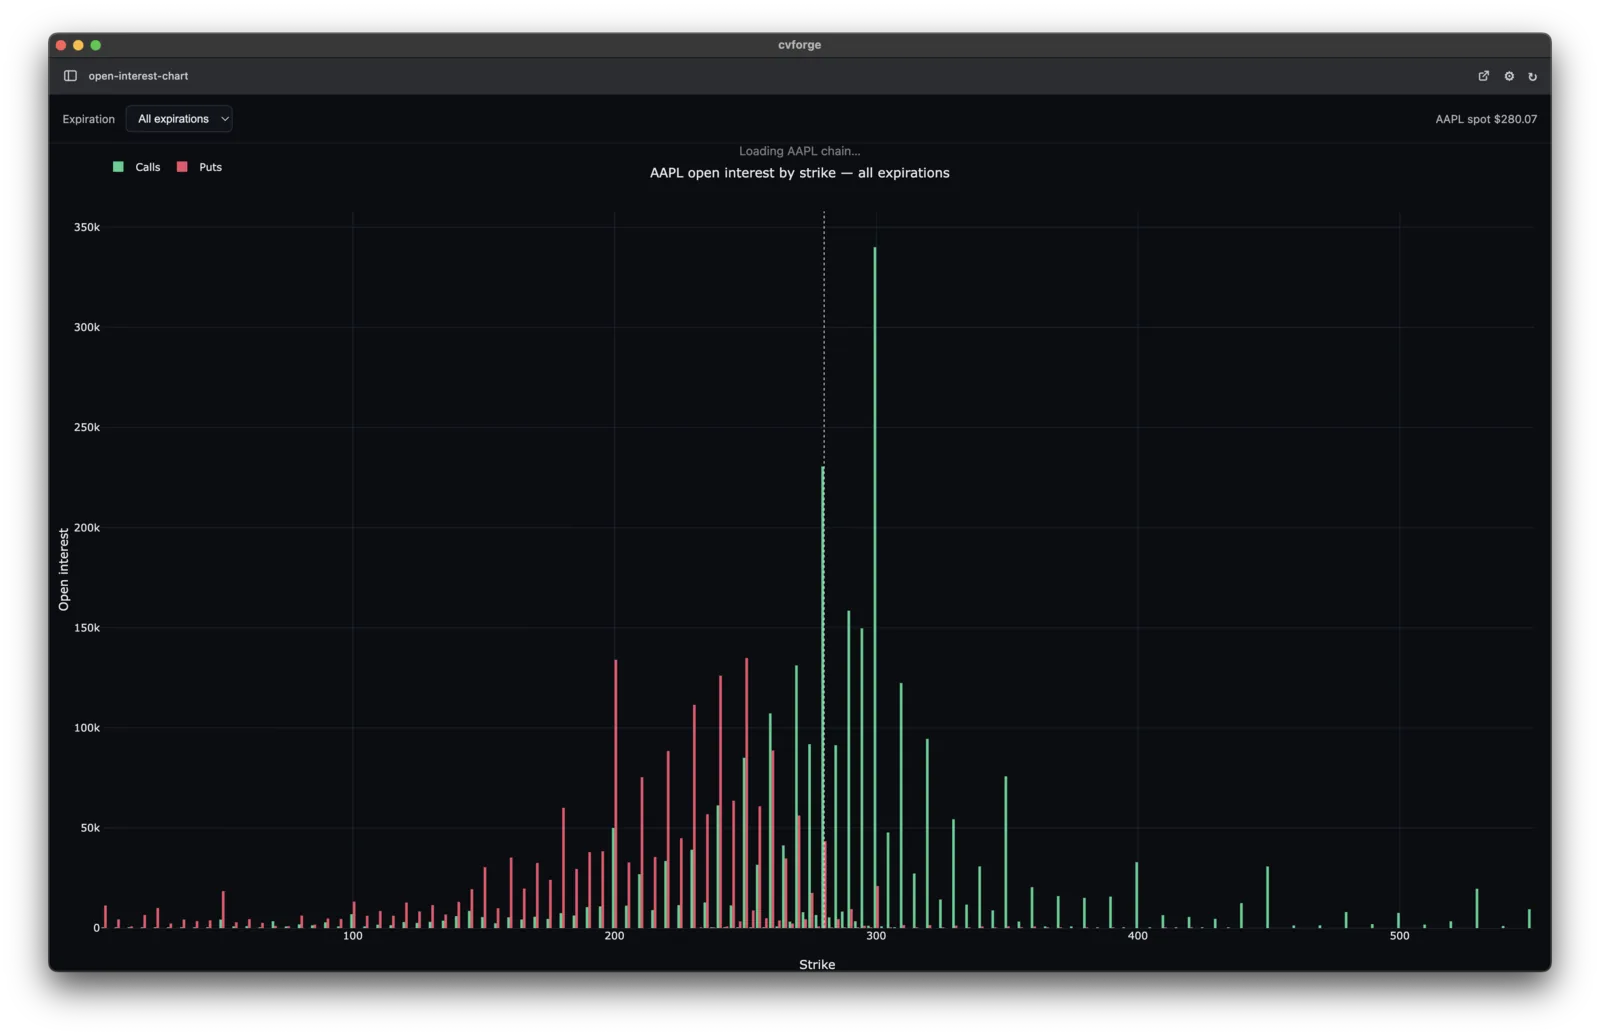
Where are the strikes everyone is positioned at? Open interest by strike is one of the fastest reads on an options market — where the walls are, where the magnets are, how positioning splits between calls and puts. Here’s the whole build:
Chart open interest by strike for SPY’s nearest monthly expiry: calls up, puts down, mirrored around the strike axis. Highlight the three largest strikes on each side. Add a ticker input and an expiry dropdown.
Type that into a new cvforge app and the agent builds it on live options data:
Iterations that earn their place
- Net positioning — “Add a toggle to show net (calls minus puts) per strike.”
- Volume overlay — “Overlay today’s volume per strike as a thin bar so I can see where positioning is changing.”
- Multiple expiries — “Stack the next four expiries as small multiples.”
- Levels for the chart-watchers — “Mark the top call and put strikes with horizontal lines and their values.”
- Auto-refresh — “Refresh every minute during market hours.”
Every one of those is a sentence to the agent, applied to the running app while you watch.
Why a live app beats a screenshot
OI-by-strike charts get passed around social media daily — as static images, usually hours old, for one ticker. Yours runs on live data, for any ticker you type, with your rules baked in. And if you publish it to the gallery, anyone with cvforge can download it, run it on their own data connection, and remix it.
Get cvforge free and build it in a minute — the free tier includes the data to run it.